Central banks tighten, bonds sell off, equities diverge

An energy shock turned policy hawkish, and markets paid the bill in yields and rand-sensitive shares.
01 MACRO OVERVIEW
A month decided by central banks, not by data
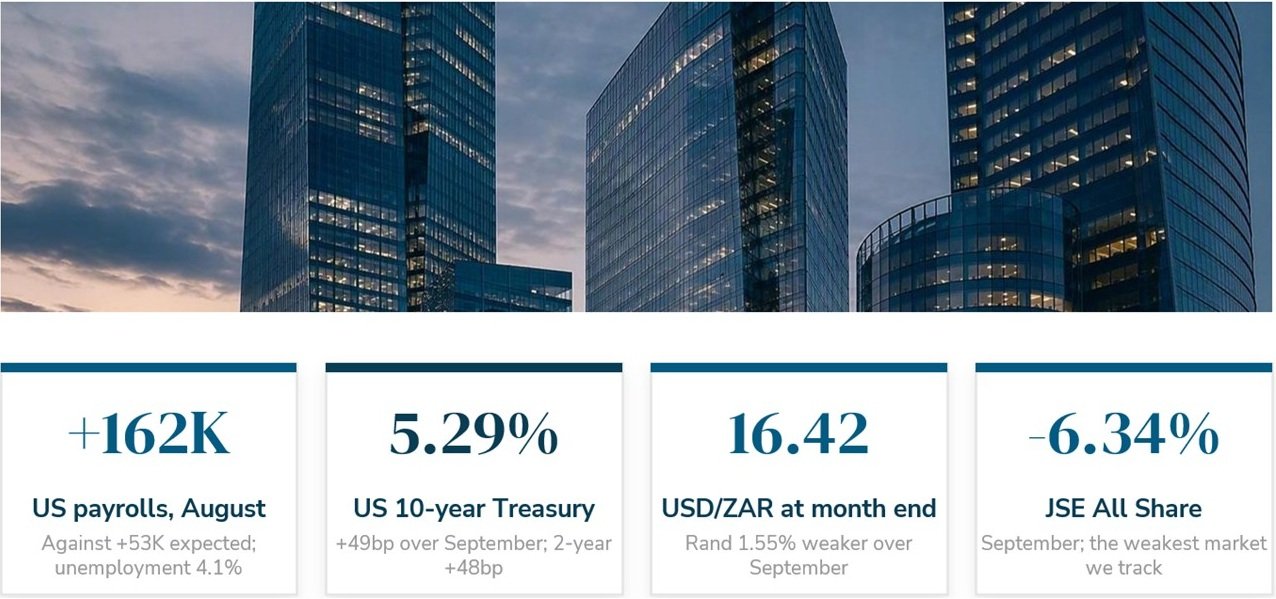
Three central banks tightened within a fortnight. The ECB raised its key rates by 25 basis points on 10 September, the Federal Reserve followed on 16 September with its first increase since 2023, taking the target range to 3.75%–4.00%, and the SARB lifted the repo rate to 7.25% on 23 September. This was largely seen as data driven: August payrolls rose 162,000 against a 53,000 consensus and unemployment held at 4.1%.
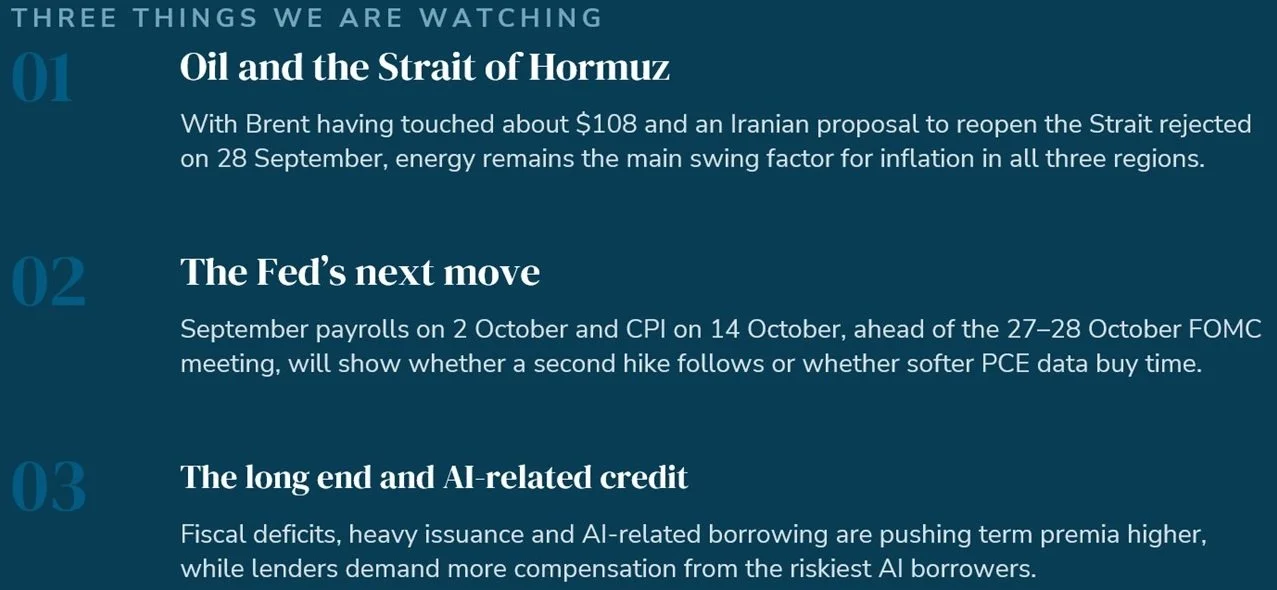
Through the month the common driver was energy. The war involving Iran kept oil near or above $100 a barrel, with Brent touching about $108 intramonth, and inflation turned higher across all three regions. US headline CPI was 3.4% in August with core at 2.4%, euro-area inflation rose to 3.2% from 2.9%, and South African inflation edged up to 4.4%, with fuel inflation running at about 20%.
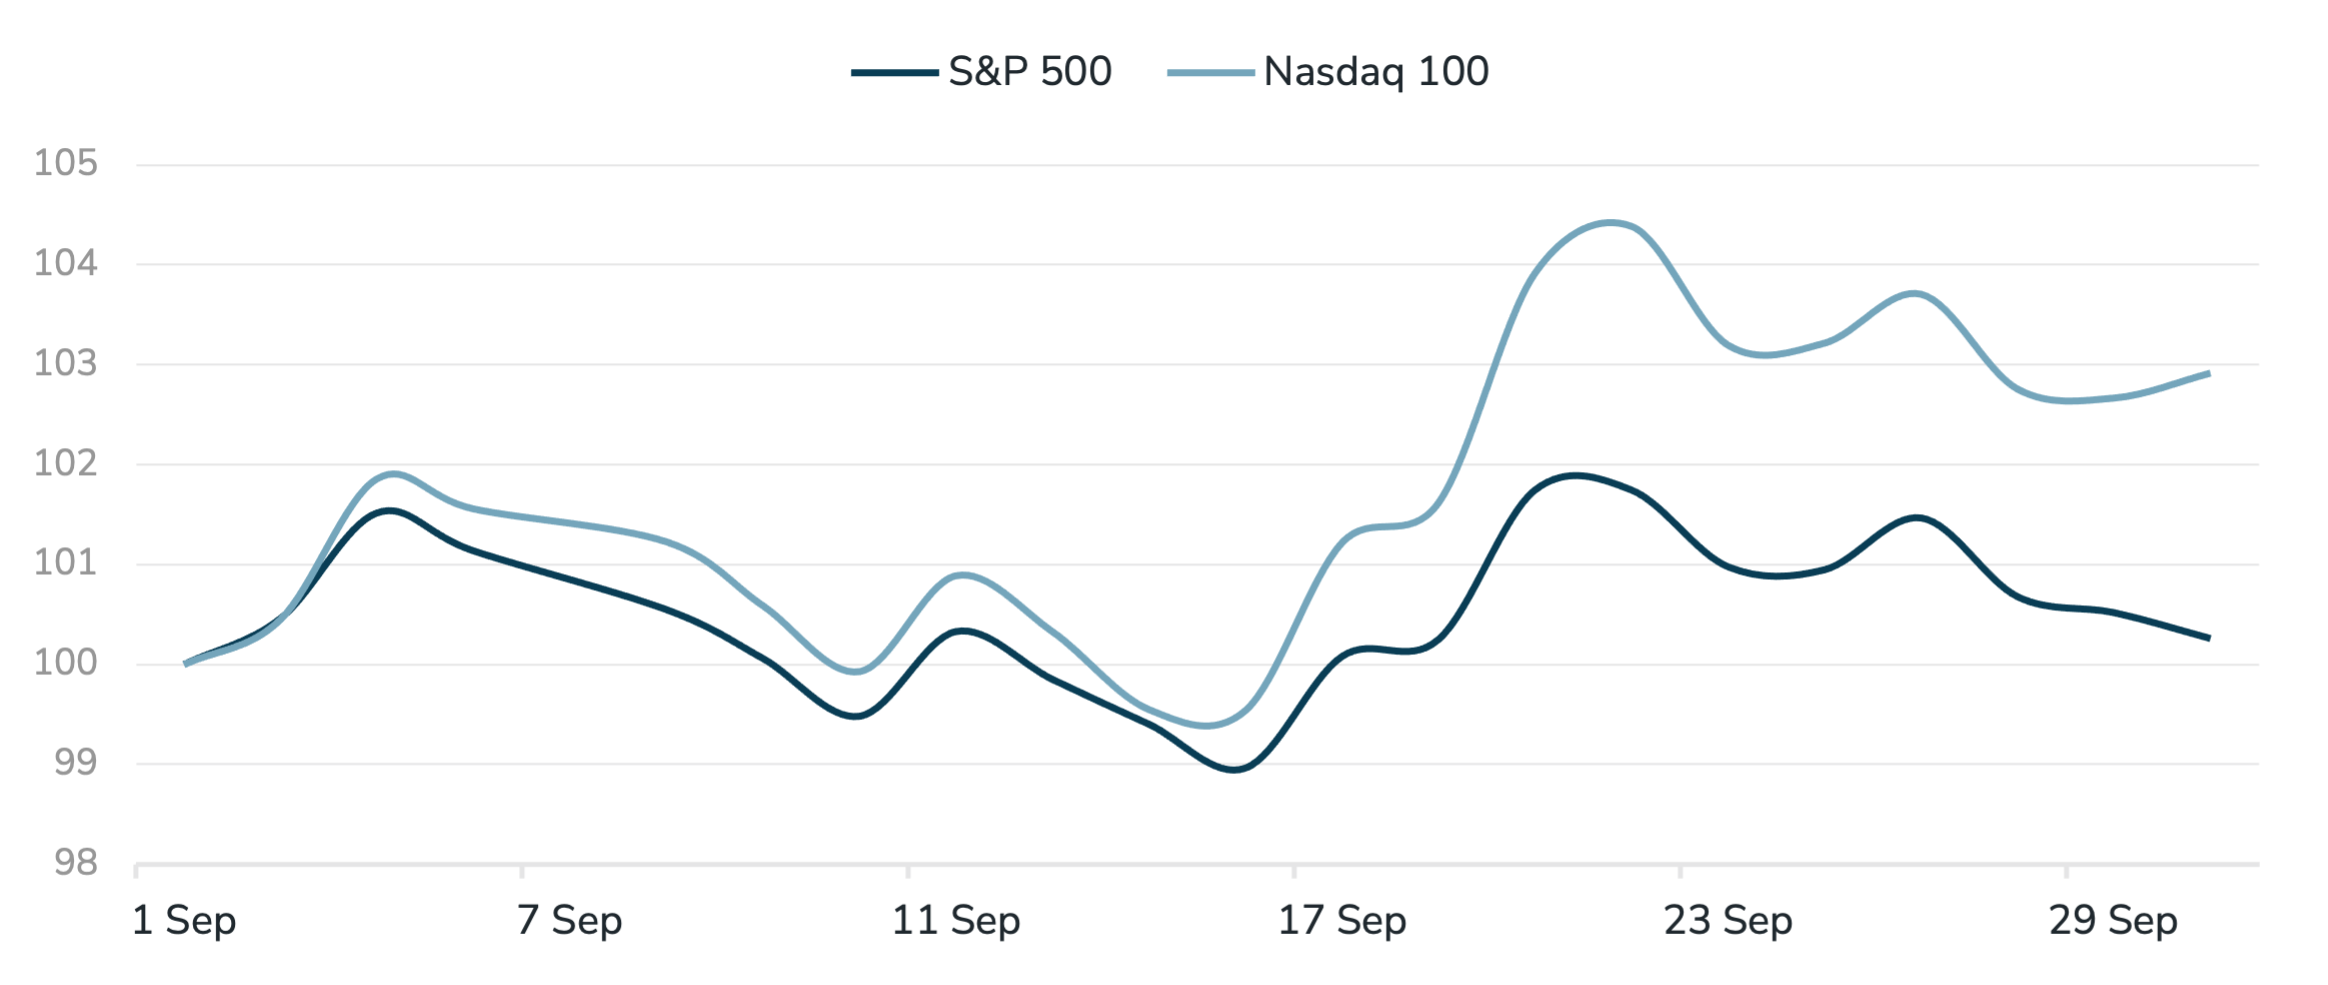
Bond markets bore the brunt. The US 10-year yield rose 49 basis points to 5.29% and the 30-year reached 5.64%, a level last seen in 2002, while the German Bund rose 24 basis points to 3.58%. Equities diverged: the Nasdaq 100 gained 2.92% on continued AI-led strength, while the DAX fell 2.97% and the JSE All Share 6.34% as a stronger dollar added to the pressure.


02 MARKET PERFORMANCE
Tech held firm as SA and Europe slipped
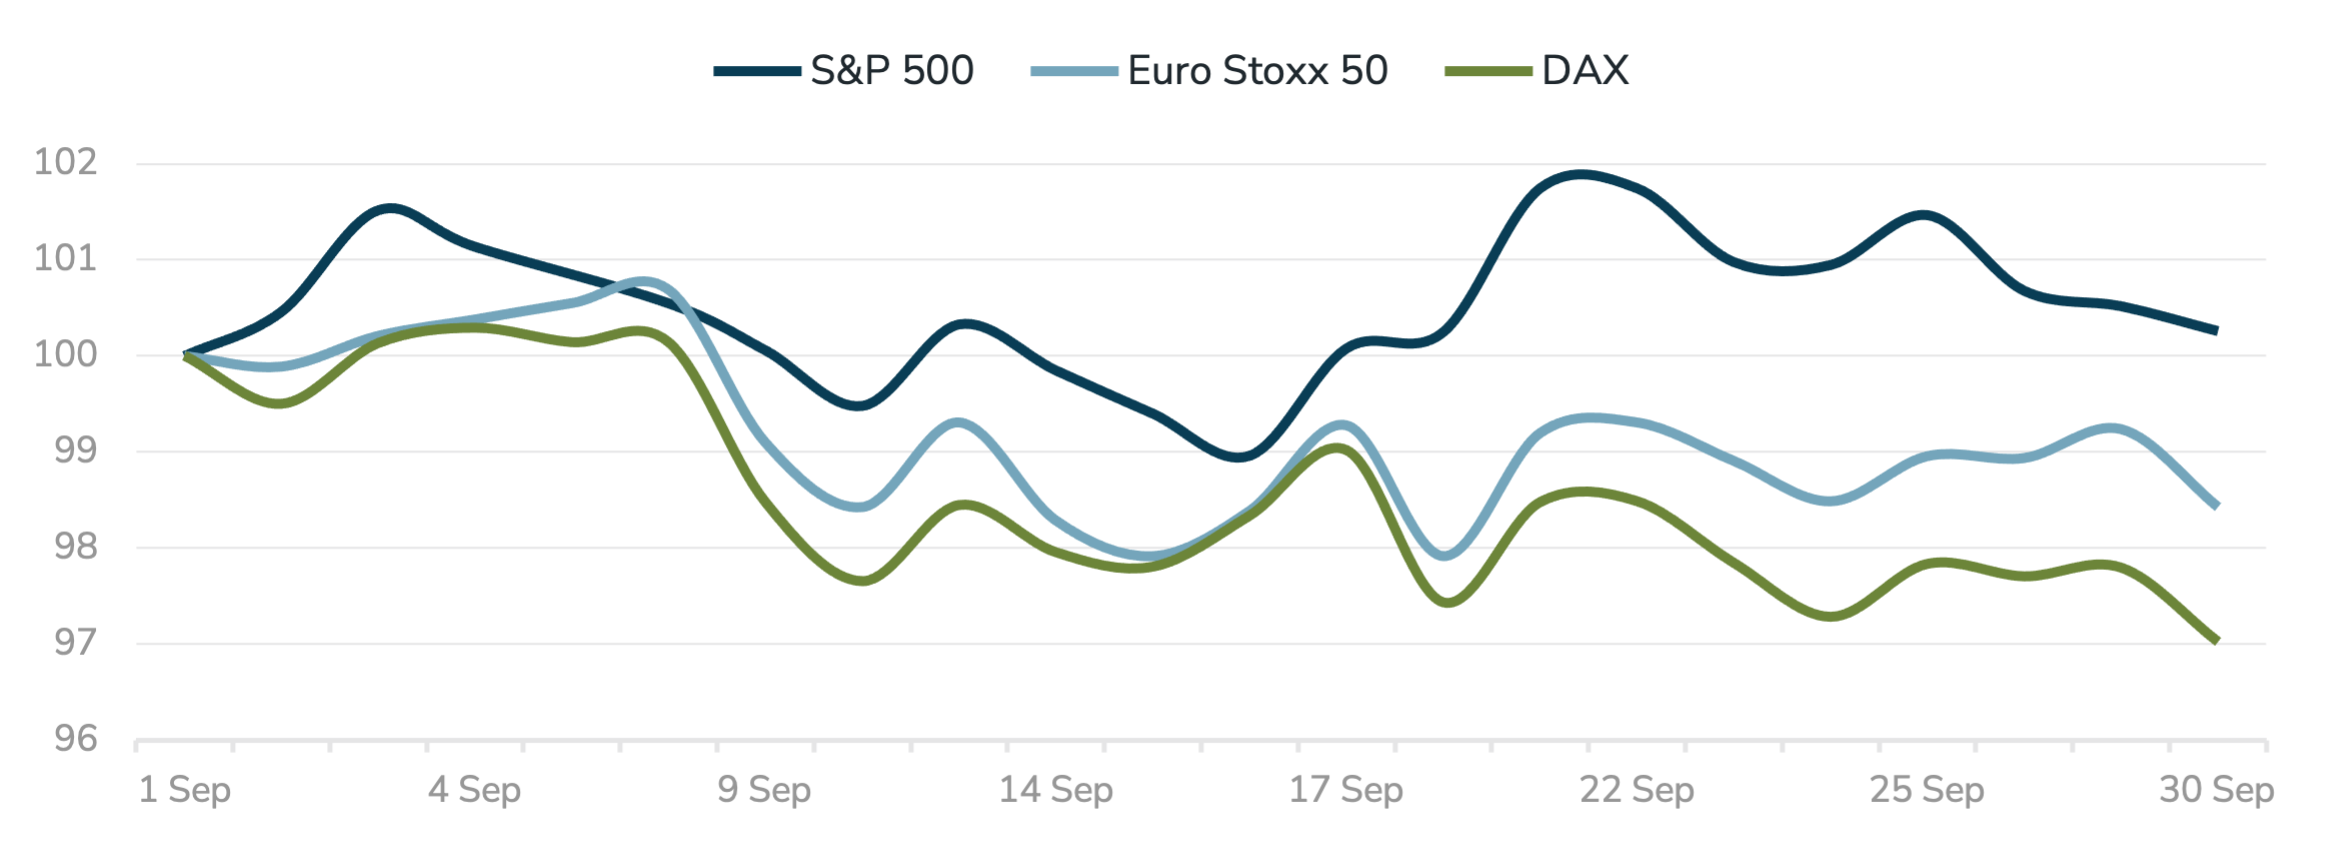
Developed-market equities - September 2026, rebased to 100 at 1 Sep
Source: LSEG. Unless otherwise stated, equity index returns are price returns in local currency terms.
The month divided into three phases. The first week was steady, with US equities firmer on strong services data. The ECB hiked on 10 September marked the turn: yields climbed and the S&P 500 reached its low around the Fed decision on 16 September. A rebound into 21–22 September, led by AI-related technology, faded in the final week as the US 10-year yield moved above 5.2% and European indices drifted lower into month-end.
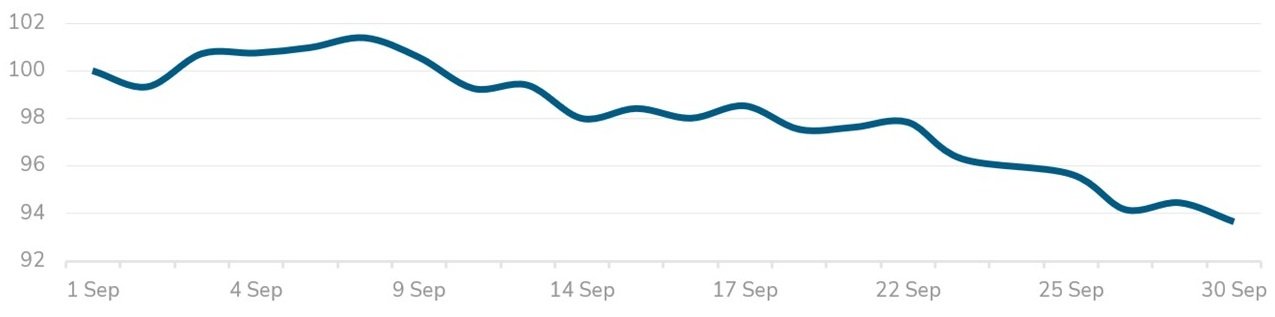
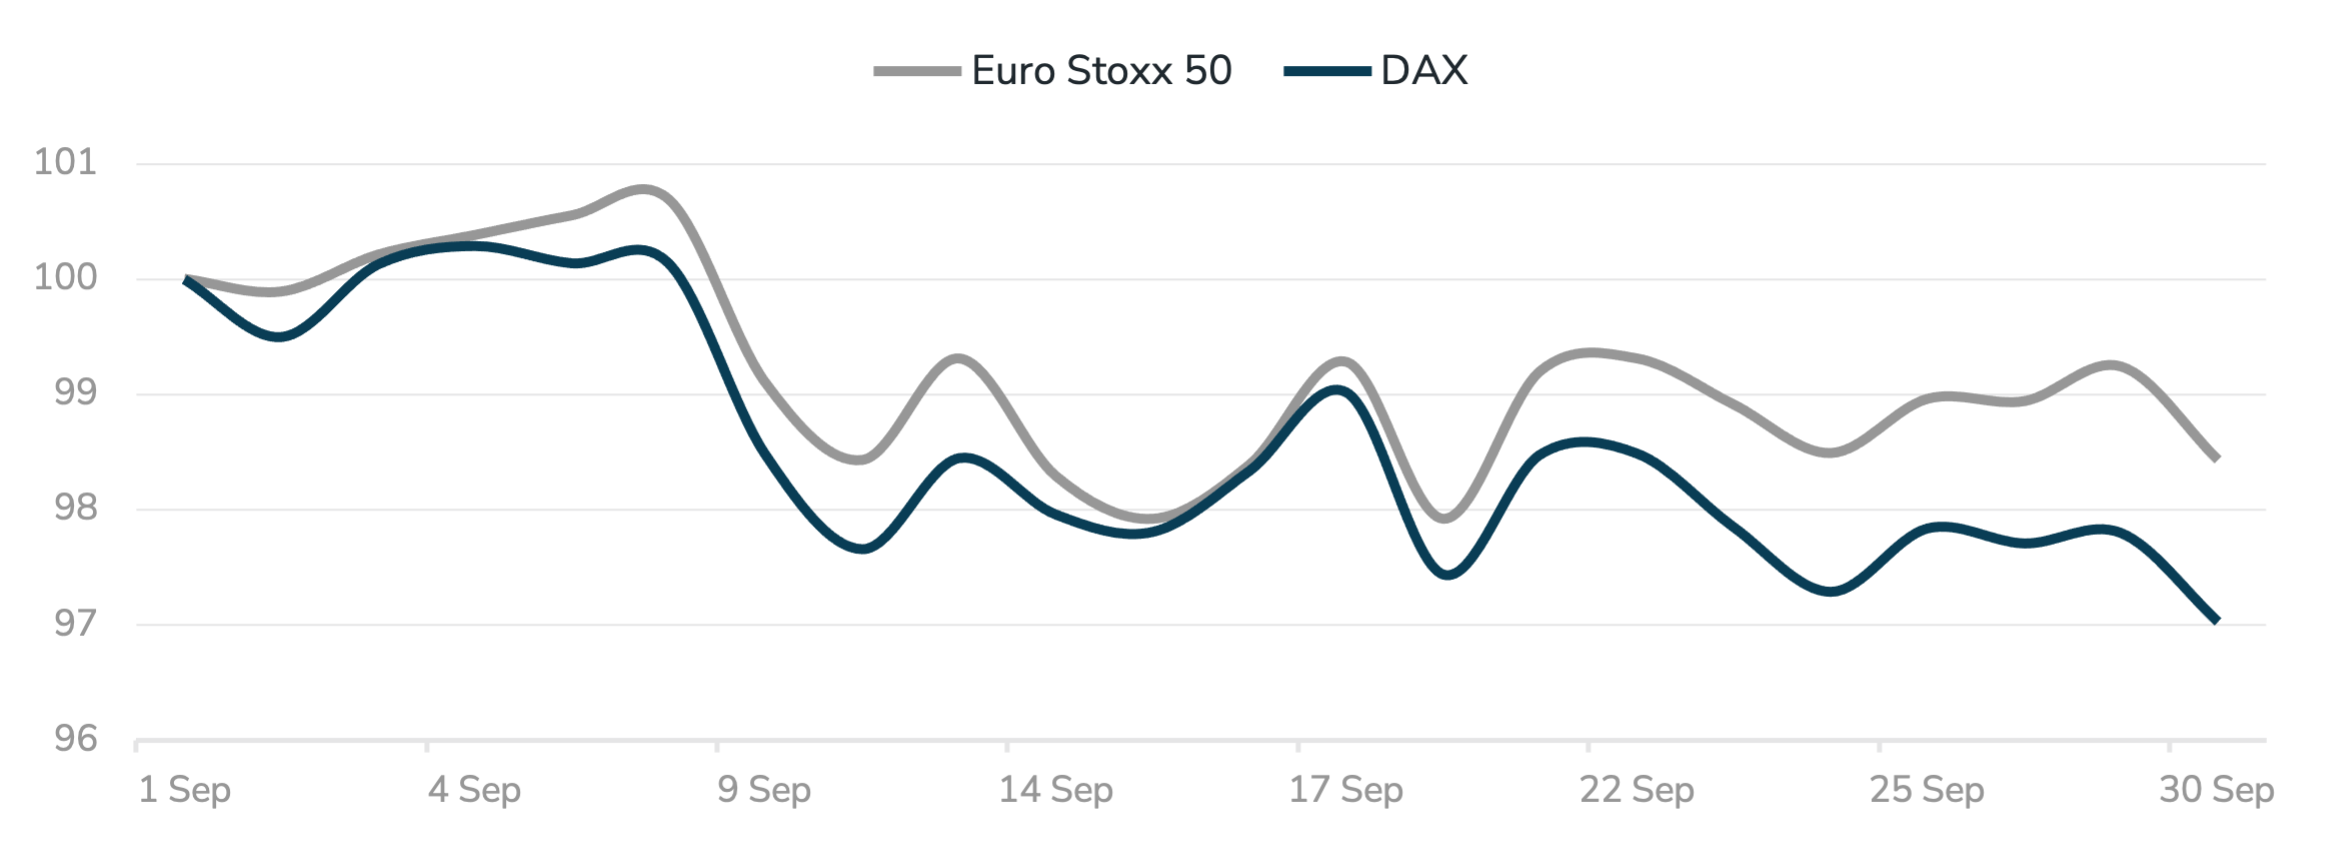
The headline outcomes diverged by region. The Nasdaq 100 rose 2.92% and the S&P 500 0.26%, while the Euro Stoxx 50 fell 1.57% and the DAX 2.97%. The JSE All Share fell 6.34%, the weakest September return of the markets shown, which may reflect a weaker rand, softer precious-metal prices and the SARB hike.
JSE All Share September 2026, rebased to 100 at 1 September
Source: LSEG. Unless otherwise stated, equity index returns are price returns in local currency terms.
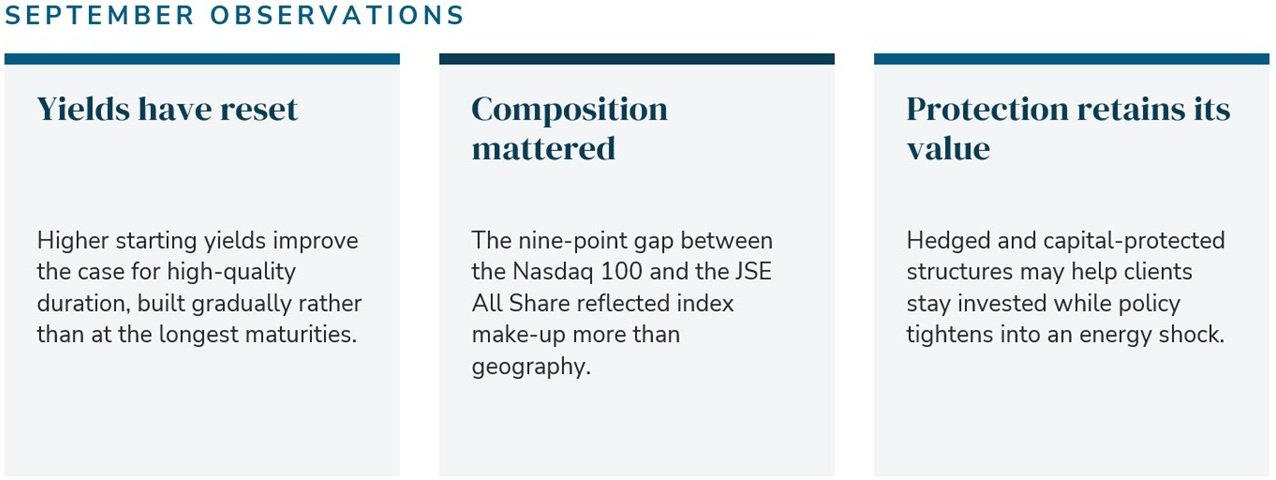
More than nine percentage points separated the strongest and weakest markets shown. September rewarded index composition more than any single regional view.
03 POLICY & INFLATION
Energy pushed inflation up, and policy followed
Headline inflation % year on year, 2026 Policy rates %, month end, 2026
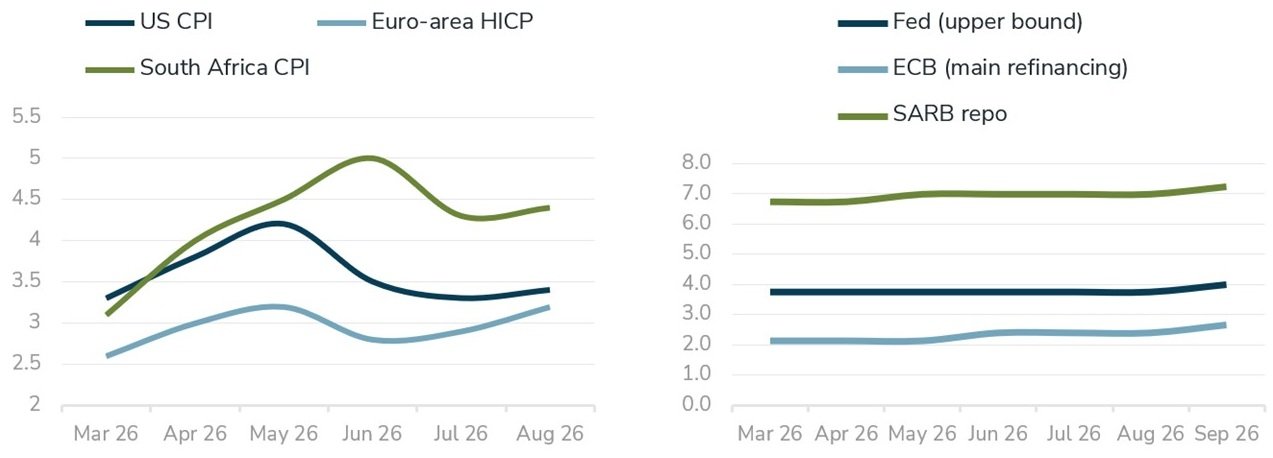
Source: Federal Reserve, ECB, SARB, BLS, Eurostat, Stats SA. Inflation shown to August, the latest full set of prints; policy rates to end-September.

Headline inflation has turned higher in all three regions. US CPI rose to 3.4% in August from 3.3% in July, with energy prices up 16.3% year on year. Euro-area inflation rose to 3.2% from 2.9%, with energy up 14.3%, and September flash prints point higher still, with Germany at 3.3% and Spain at 5.0%. South African CPI edged up to 4.4%, and the SARB expects inflation above 5% later this year.
Core measures are more contained, which makes the policy response a judgement about persistence rather than a reaction to current prices. US core CPI and euro-area core inflation were both 2.4% in August, but services inflation remains elevated and the shared concern is second-round effects into wages and services prices. Sixteen of 18 FOMC members now project at least one further hike this year.
When central banks tighten into a supply shock, they buy credibility at some cost to growth. That trade-off, rather than the level of inflation alone, is likely to set the tone for the months ahead.
04 DATA SURPRISES
Activity surprised to the upside as inflation re-accelerated

Largest surprises versus consensus September 2026 releases, actual less consensus
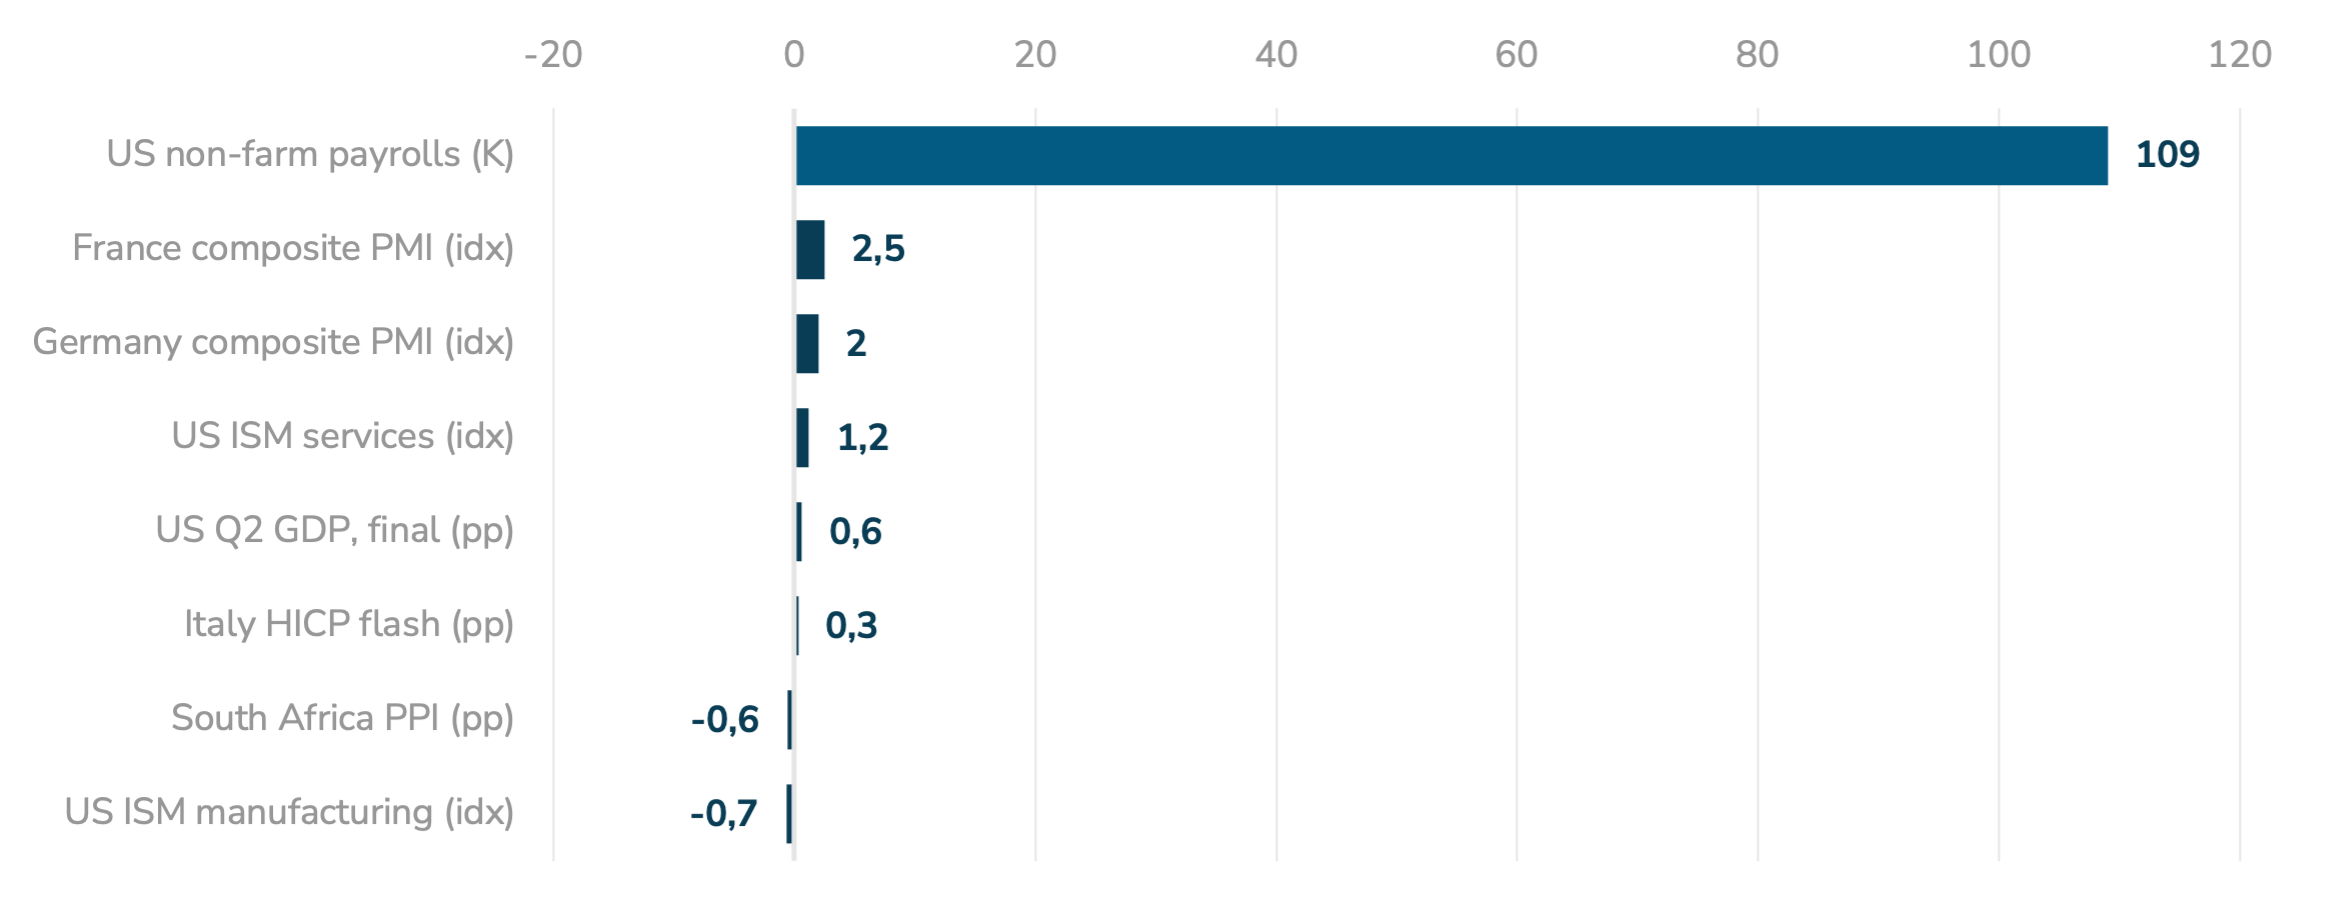
Source: Douglas Investments analysis; LSEG.
The month’s surprises cluster in activity rather than in prices. August payrolls rose 162,000 against a consensus of 53,000, with July revised from a 23,000 decline to a 21,000 gain; final second-quarter GDP was 2.2% annualised against 1.6% expected; and the ISM services index beat by 1.2 points at 55.4. Euro-area flash composite PMIs surprised most, with France 2.5 points and Germany 2.0 points above consensus.
NOTE: The measures are not directly comparable. Payroll surprises are in thousands of jobs, GDP and price data in percentage points, and PMIs in index points.
Inflation surprises were smaller but leaned the same way: September flash HICP beat consensus in all four large euro-area economies, by 0.3 points in Italy and 0.2 points in France. The exceptions were South Africa and US manufacturing. South African producer price inflation came in at 5.0% against 5.6% expected and CPI at 4.4% against 4.5%, while the ISM manufacturing index missed by 0.7 points at 54.6. US August PCE inflation was also below consensus, although methodology revisions mean that comparison needs care.
Upside surprises in activity alongside firmer inflation removed much of the near-term case for easing, and help explain why central banks moved together.
05 RATES & CURRENCIES
A stronger dollar and a sharp rise in yields
US Treasury yields %, daily, September 2026
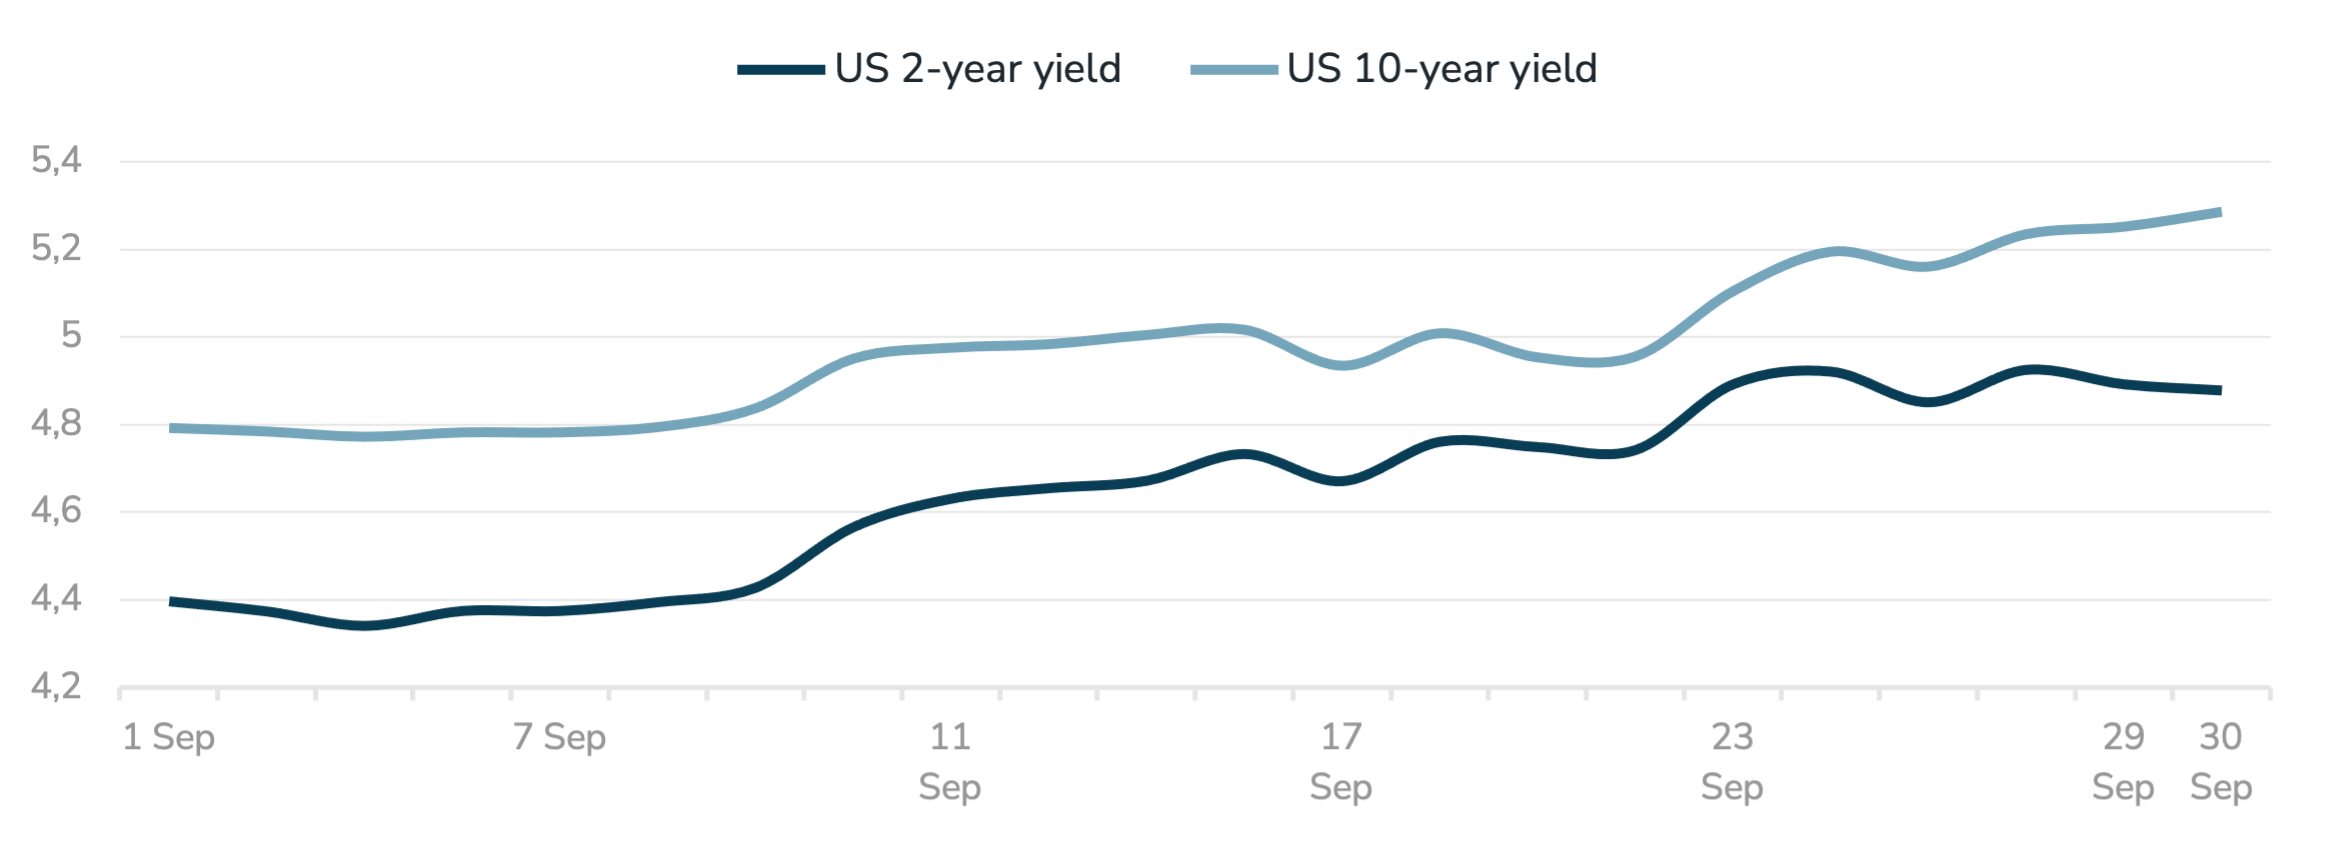
Note: the 2s10s spread was broadly unchanged, ending the month at about 41bp.
Source: LSEG.
The dollar strengthened on rising rate expectations, mainly at the euro’s expense. EUR/USD fell 2.27% to 1.133 and the rand weakened 1.55% to 16.42 against the dollar, pressured mid-month by higher oil and softer precious-metal prices. Japan continued to warn against further yen weakness.
Bond yields rose across the developed world. The US 10-year rose 49 basis points to 5.29% and the two-year 48 basis points to 4.88%, a broadly parallel shift. The 30-year reached 5.64%, last seen in 2002. The German 10-year Bund rose 24 basis points to 3.58%, near its highest since 2009, and Japan’s 10-year yield reached a 30-year high. Analysts attributed much of the move to a rising term premium: elevated oil, heavy Treasury issuance, large fiscal deficits and AI-related corporate borrowing.
Ten-year yields September 2026, rebased to 100 at 1 September
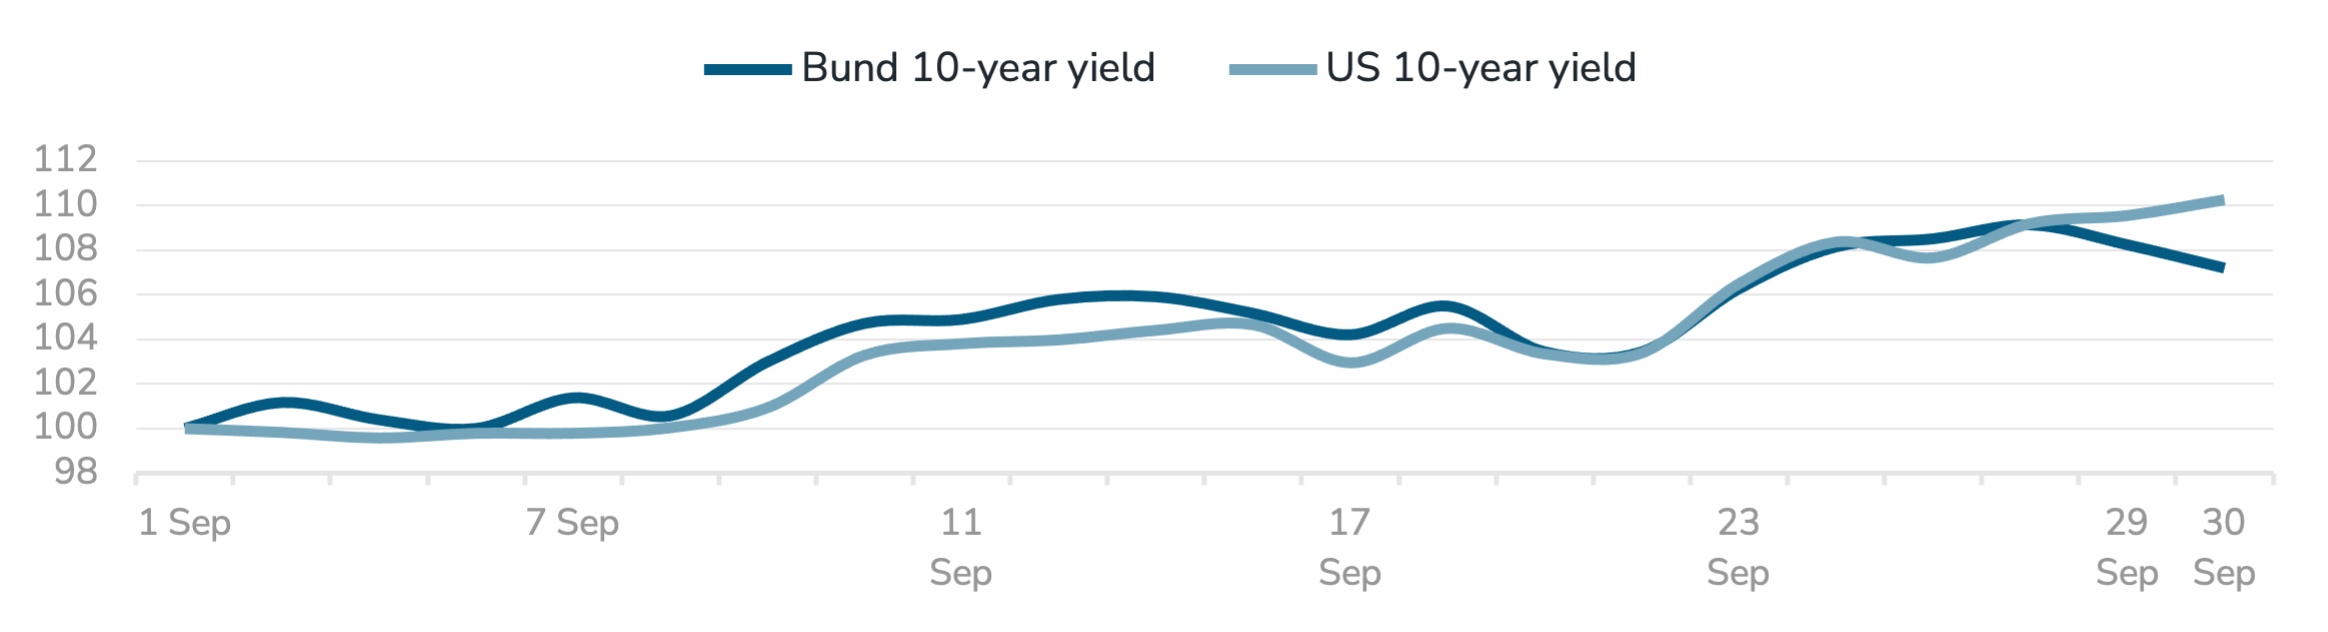
For a rand-based investor with USD investments the combination cuts both ways: a weaker rand lifts the rand value of offshore returns but adds to imported inflation as fuel prices rise.
06 UNITED STATES
Firm growth, a hawkish Fed and a long end under strain

S&P 500 and Nasdaq 100 September 2026, rebased to 100 at 1 Sep
Source: LSEG
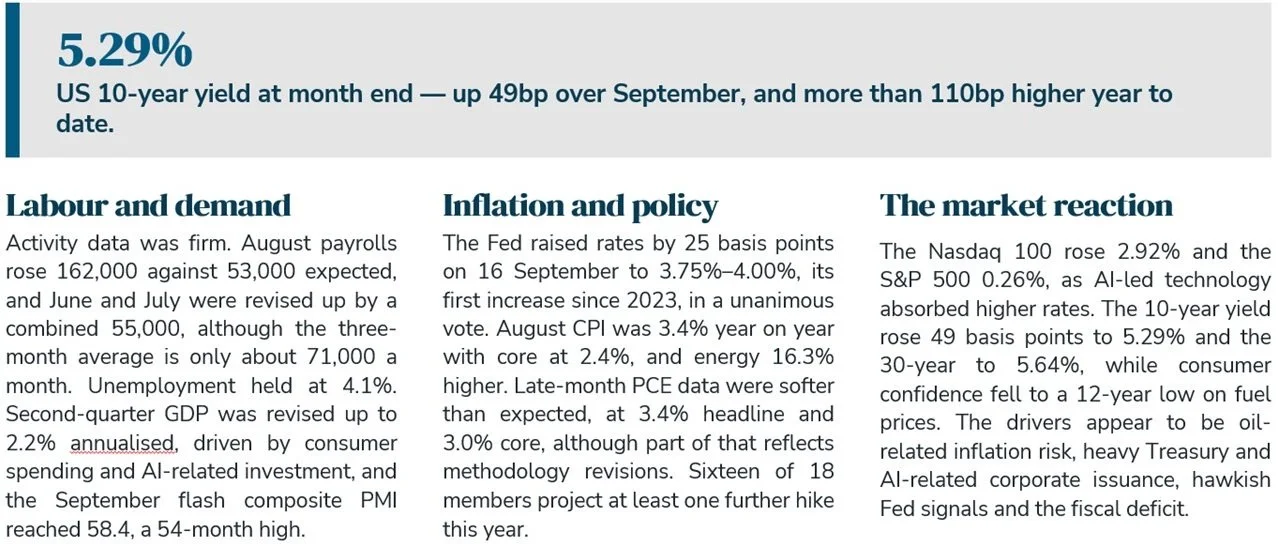
Higher yields improve the starting return on quality duration, but a rising term premium argues for building it gradually. Equity leadership concentrated in AI-related technology may overstate breadth. The principal risk is a further leg higher in long yields.
07 EUROPE & THE UNITED KINGDOM
Resilient activity, rising inflation and a hawkish ECB
Euro Stoxx 50 and DAX September 2026, rebased to 100 at 1 Sep
Source: LSEG. Unless otherwise stated, equity index returns are price returns in local currency terms.
The euro-area picture was firmer on activity and worse on inflation. August HICP rose to 3.2% from 2.9%, with energy 14.3% higher, while core eased to 2.4%. September flash prints point higher, with Germany at 3.3%, France 3.0%, Italy 4.1% and Spain 5.0%, all above consensus. Second-quarter GDP was revised up to 0.6% quarter on quarter and the flash composite PMI rose to 53.1, a near three-and-a-half-year high. The ECB raised its key rates by 25 basis points on 10 September, taking the deposit rate to 2.50%.
Equities gave ground as yields rose: the DAX fell 2.97% and the Euro Stoxx 50 1.57%. Bund yields rose 24 basis points to 3.58% and EUR/USD fell 2.27%. In the United Kingdom, second-quarter growth was revised up to 0.5%, placing Britain at the top of the G7 table for the first half.
German 10-year Bund yield %, daily, September 2026
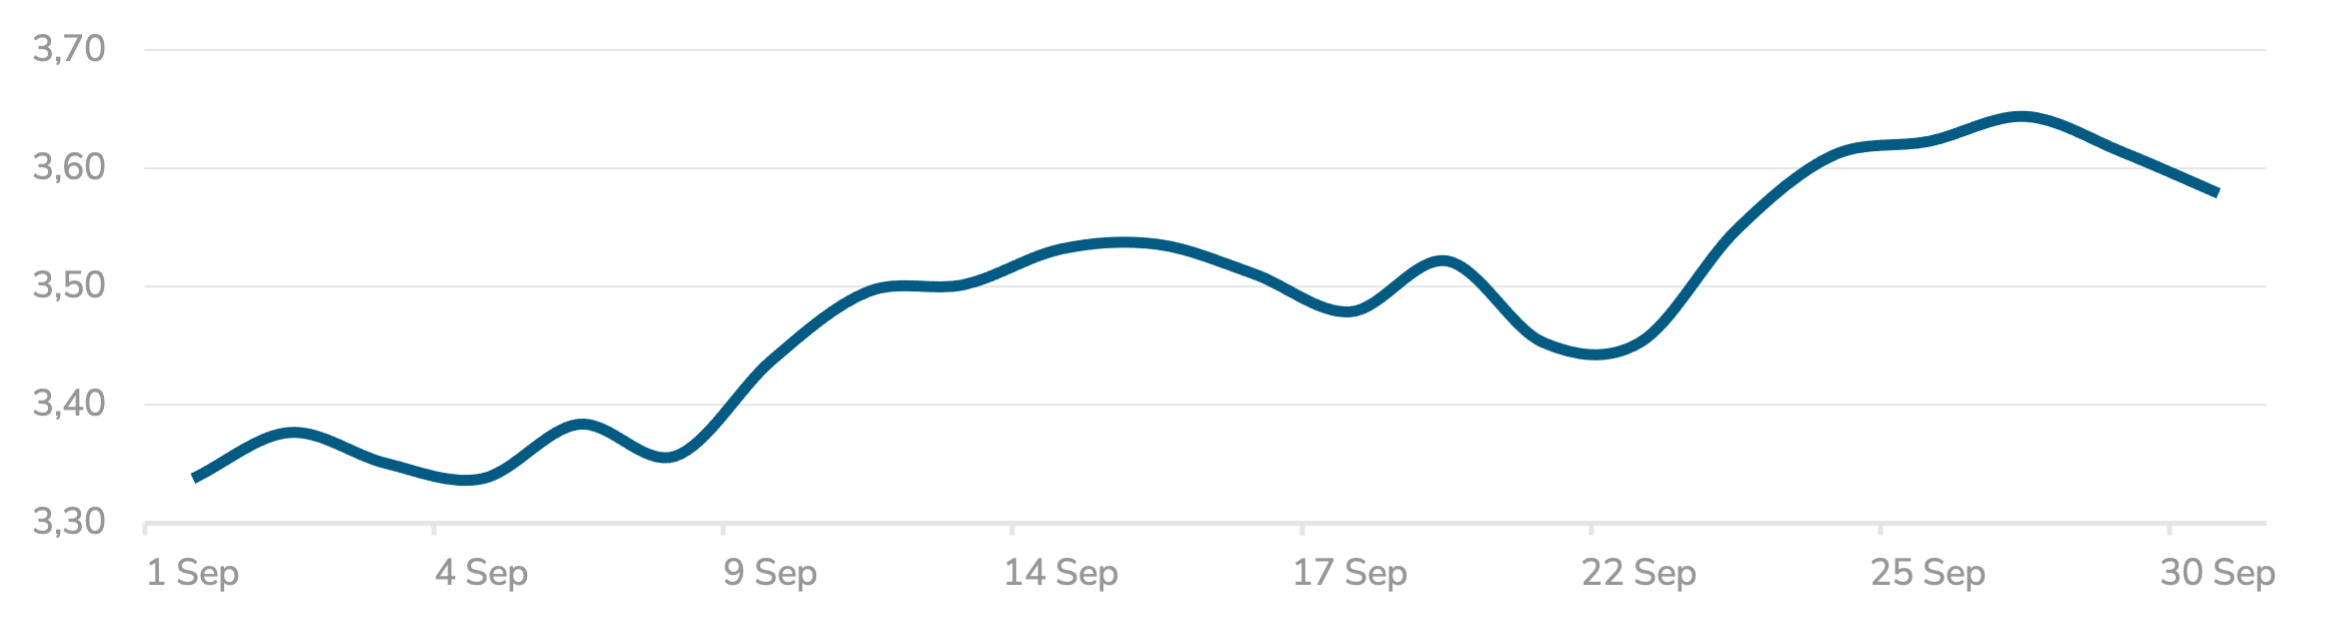
Most economists expect the ECB to hold on 29 October and hike again in December. Bund duration offers its best carry in well over a decade, though a rising term premium limits the room for capital gains while the energy shock persists.
08 REGIONAL SCORECARD
Three economies, one shared shock
Cross-region equity returns %, September 2026 price return
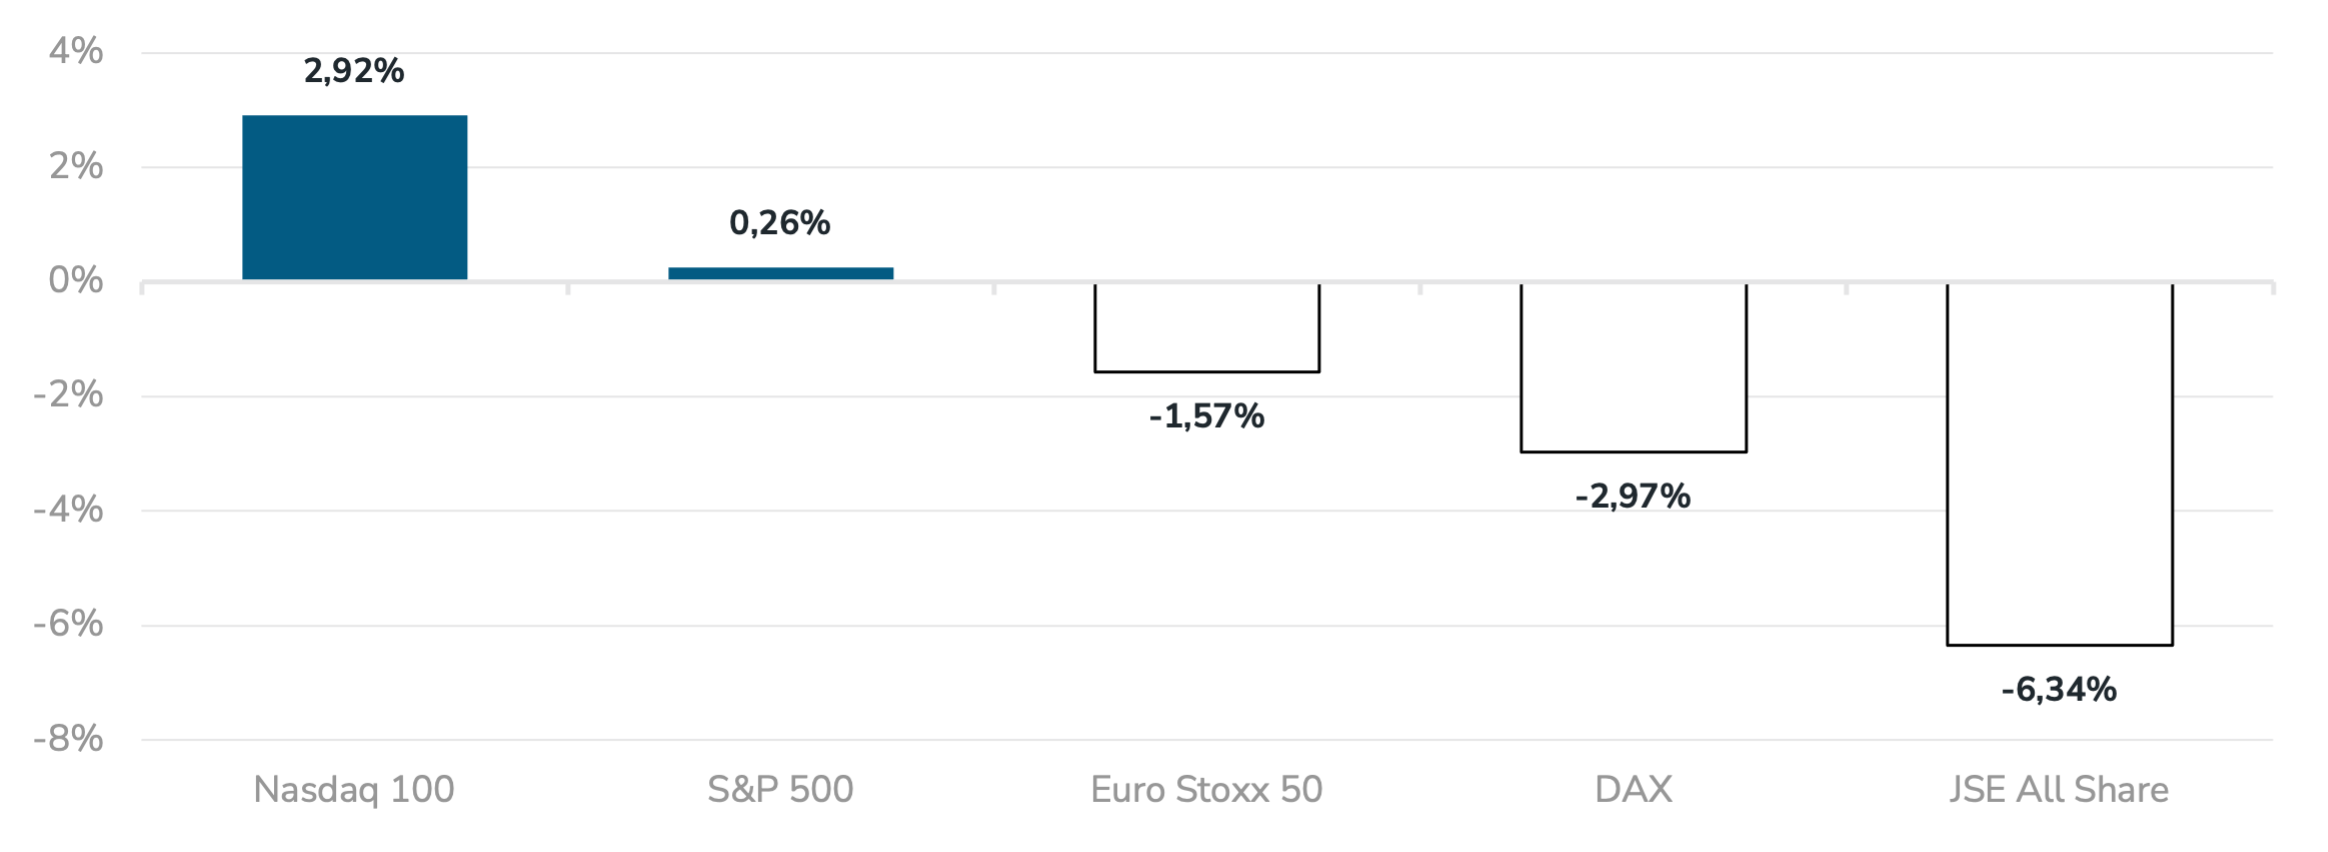
Source: LSEG. Unless otherwise stated, equity index returns are price returns in local currency terms. Returns are from 1 to 30 September 2026. The ECB, the Fed and the SARB each raised rates by 25 basis points during September.
September data releases describe one common shock with different consequences. The United States combines firm growth and a resilient labour market with a hawkish Fed and the sharpest rise in long yields.
The euro area pairs improving activity with the clearest re-acceleration in inflation. South Africa is the weak link on growth, with a second-quarter contraction and 33.6% unemployment, even as the SARB tightens into a fuel-price shock.
September macro releases inflation, labour, policy and activity
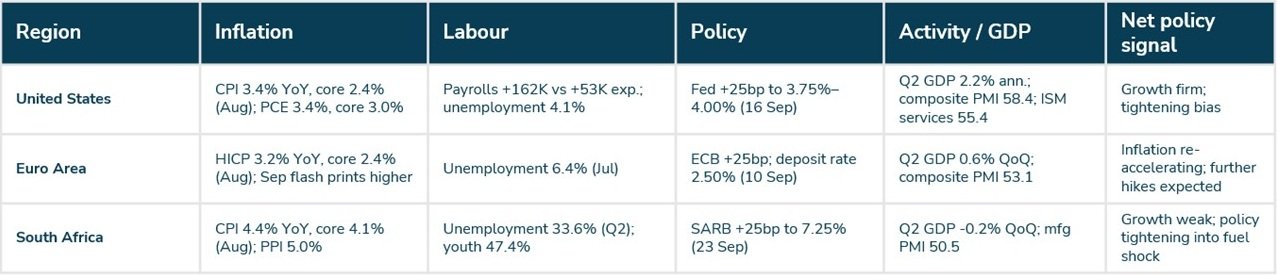
When one shock drives policy everywhere, breadth across regions does less of the work, and breadth across asset types and structures does more.
09 SOUTH AFRICA
Tighter policy and a weaker rand, with growth contracting
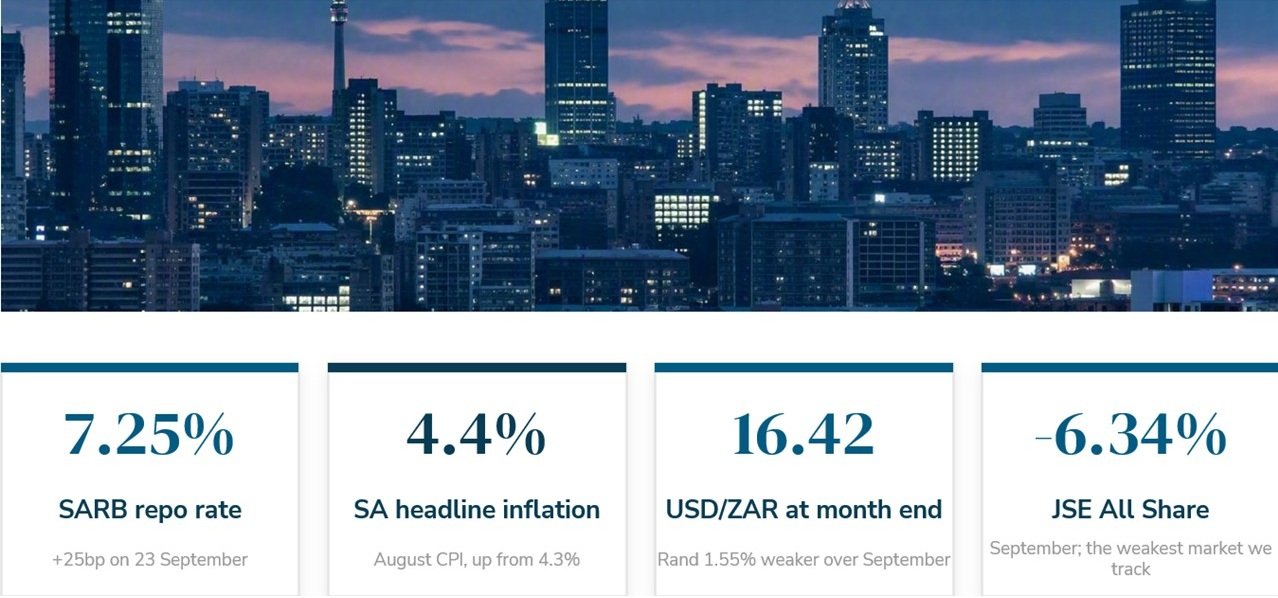
The SARB raised the repo rate by 25 basis points to 7.25% on 23 September, by unanimous vote and its second increase this year, citing the war-driven price shock and tightening by the Fed, the ECB and the Bank of Japan. August CPI edged up to 4.4% with core at 4.1%. Food inflation is only 1.1%, but fuel inflation is running at about 20%, and a further petrol increase of more than R3 a litre is indicated for October. The SARB expects inflation above 5% later this year before a return towards 3% by late 2027.
Growth is the weak link. Second-quarter GDP contracted 0.2%, ending six consecutive quarters of growth, with mining, trade and manufacturing the main drags, and unemployment rose to 33.6%. The JSE All Share fell 6.34%, the weakest of the markets we track, and the rand weakened 1.55% to 16.42. The external position was a relative bright spot, with an August trade surplus of R20.5 billion against R16.6 billion expected.


10 POSITIONING
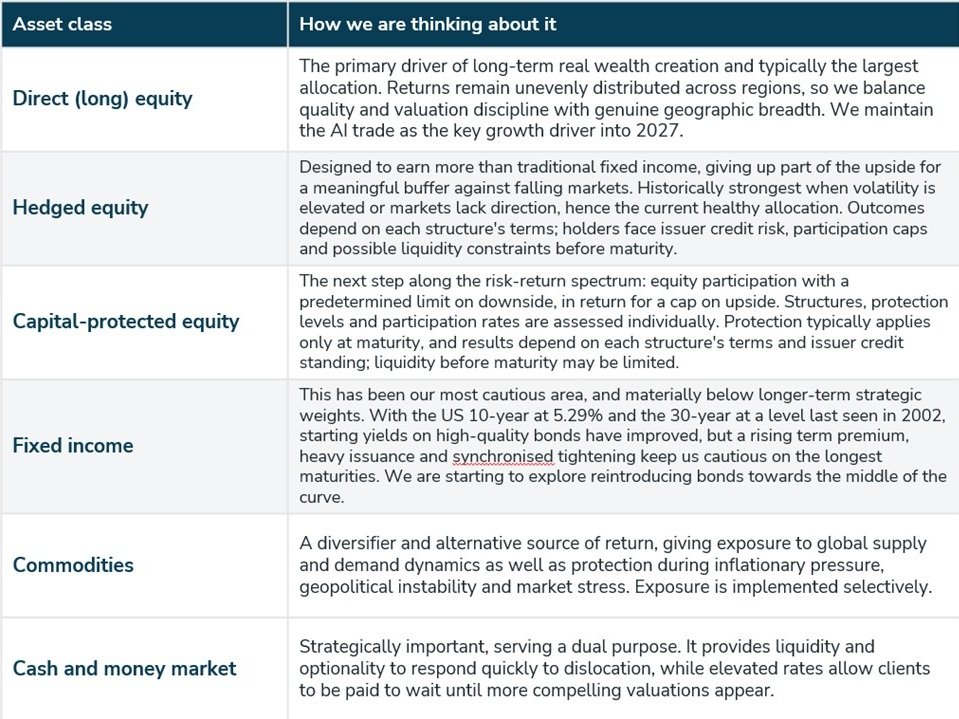
Participating in opportunity without compromising on risk
Our house view remains positive but measured in our allocation to growth assets, and the framework below is strategic rather than a response to any single month. September added observations rather than a change of direction: central banks have turned towards tightening, long yields have reset materially higher, and equity outcomes have diverged sharply by index composition. Weightings are always tailored to a client’s objectives, risk tolerance, liquidity needs and time horizon.
11 OUTLOOK
A hawkish turn into an energy shock
September shifted the central question from whether slowing labour data would allow easing to how far central banks will tighten into an energy shock. The ECB, the Federal Reserve and the SARB each raised rates by 25 basis points within a fortnight, and sixteen of 18 FOMC members now project at least one further hike this year. The data provided room to act: August payrolls rose 162,000 against a 53,000 consensus, prior months were revised up by 55,000, second-quarter GDP was revised up to 2.2% annualised and the US composite PMI reached a 54-month high. Inflation moved the other way, with US headline CPI at 3.4%, euro-area inflation at 3.2% and higher September flash prints across the euro area.
Bond markets absorbed the adjustment. The US 10-year rose 49 basis points to 5.29%, the 30-year reached 5.64% and the Bund rose 24 basis points to 3.58%, while the dollar strengthened against the euro and the rand. The move appears to reflect a rising term premium as much as policy expectations: elevated oil, heavy Treasury issuance, large deficits and AI-related corporate borrowing all point the same way. Softer-than-expected August PCE data at month-end tempered expectations of an October Fed hike, lending a modestly steadier tone into October.
Regionally, the burden is uneven. The United States combines firm growth with a hawkish Fed and equity leadership concentrated in AI-related technology; the euro area pairs improving activity with re-accelerating inflation; and South Africa faces tighter policy, rising fuel prices and a second-quarter contraction. The principal risk, in our view, is that oil stays near $100 while long yields keep rising, which would tend to pressure duration and equity valuations together.