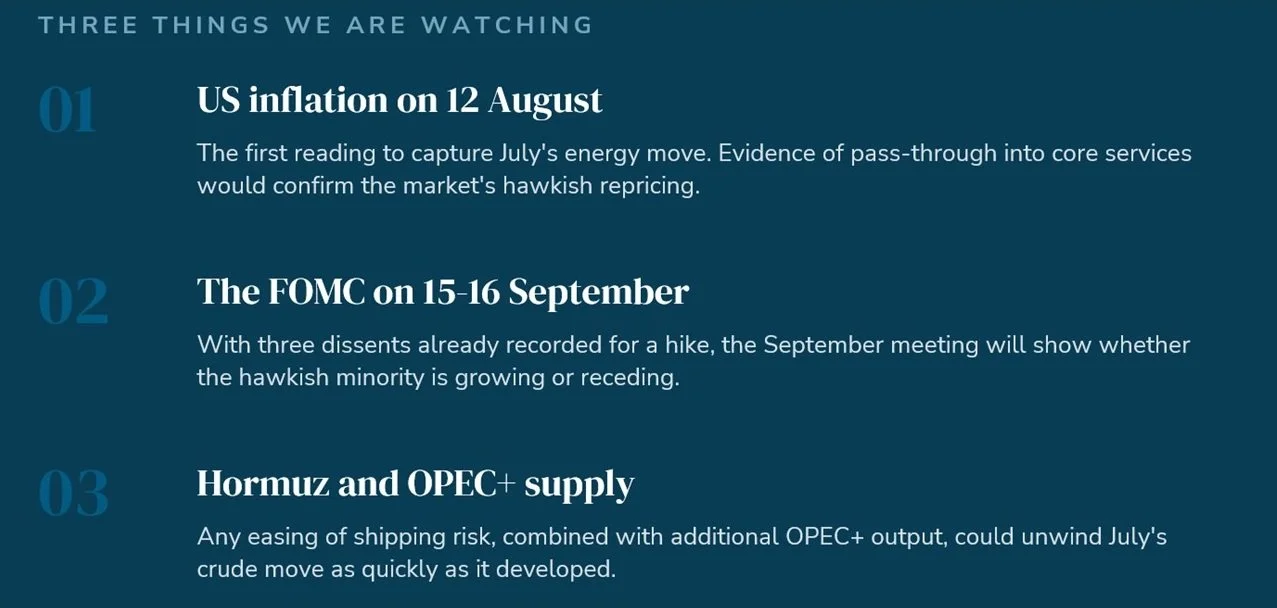
Oil, the Fed and a market that rotated - July 2026

A data-led review of energy, inflation, policy rates, equities, currencies and South African markets — in a month when a supply shock and a hawkish Federal Reserve reshaped returns
01 MACRO OVERVIEW
A supply shock meets a central bank that will not blink.


July was once again defined by a recurring and dominant macro theme. Conflict involving Iran and the risk of disruption through the Strait of Hormuz pushed Brent crude from $71.57 to $90.12 a barrel, a 23.6% move in a month and 47.9% for the year to date. Higher energy costs fed directly into inflation expectations, and with US headline PCE inflation already running at 3.7% year on year, the Federal Reserve had no room to accommodate the shock.
The Federal Open Market Committee held the target range at 3.50-3.75% on 29 July, but the vote was 9-3, with three regional presidents dissenting in favour of a hike. That hawkish tone lifted yields across the curve with the 10-year reaching 4.71%, 27 basis points higher on the month. This resulted in pressure on the assets most sensitive to the discount rate – i.e. long-duration technology equities and long-dated government bonds alike.
The market response was rotation rather than retreat. The S&P 500 finished July essentially flat while the Nasdaq 100 fell 6.6% and emerging markets lost 3.3%, with a softer dollar did little to cushion them. The capital rotated out of the crowded growth and technology sector and into Energy and value, which absorbed the shock.


02 MARKET PERFORMANCE
A rotation month, not a broad risk-on month
Global equities, total return 2026 year to date, %
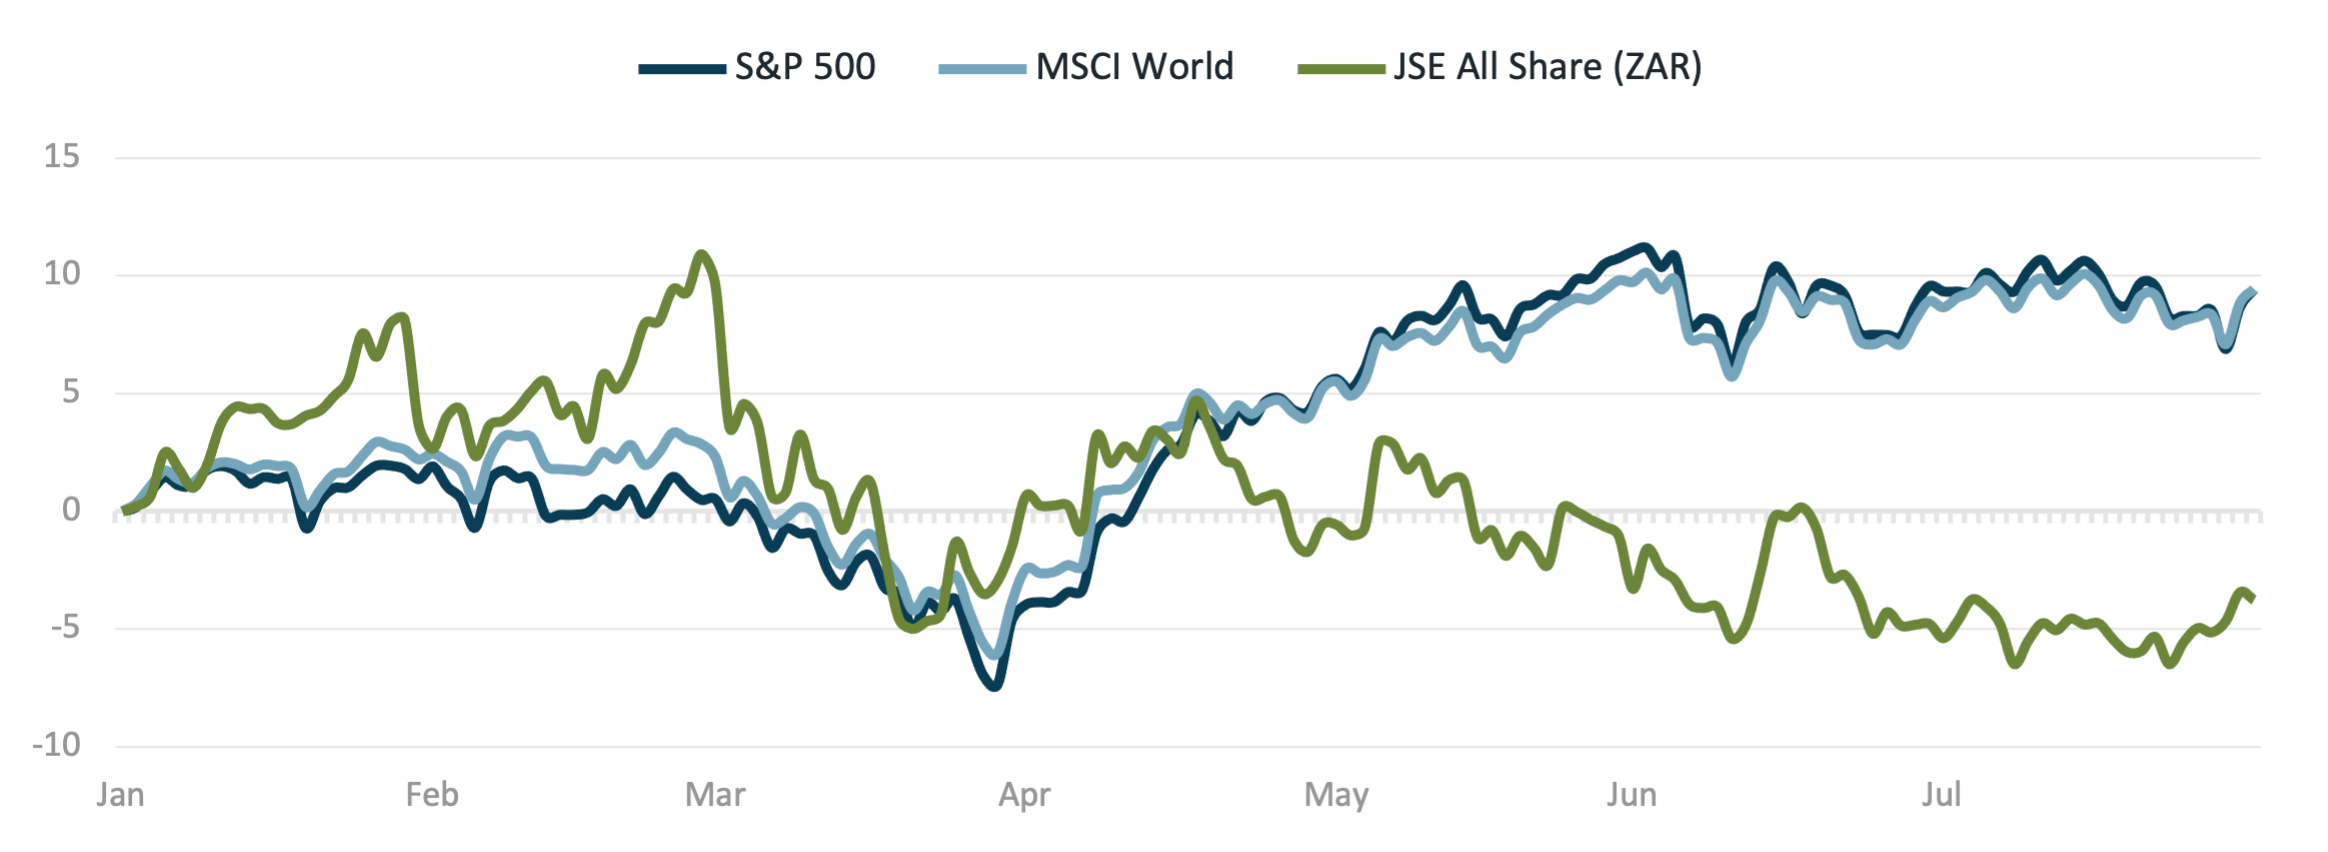
Source: Douglas Investments analysis; LSEG. Percentage total return from 1 January 2026, in index currency
Headline index moves understated how much changed beneath the surface. The S&P 500 slipped just 0.13% over July, yet the Nasdaq 100 fell 6.60% as higher discount rates compressed the valuations of the longest-duration growth names. Amazon rose 15.3% on results while Apple fell 7.4% — dispersion within the mega-caps was as wide as at any point this year, and a reminder that the index level can conceal a substantial reallocation of capital between its constituents.
The mechanism driving market levels matters. Nothing in July's data suggested that corporate earnings were deteriorating. Rather, the rate at which those earnings are discounted changed. That is why energy and value exposures outperformed while long-duration growth lagged, and why emerging markets fell 3.31% despite unchanged fundamentals. The Nikkei's 8.14% decline was primarily currency-driven, following coordinated intervention by Japan, Korea and the United States, yet it remains the strongest major market of 2026, up 26.65%.
The S&P 500 has shown a total return of +9.4% in 2026 to date, despite a flat July and a sharp repricing of technology valuations.
Nasdaq 100 rebased to 100 2026 year to date
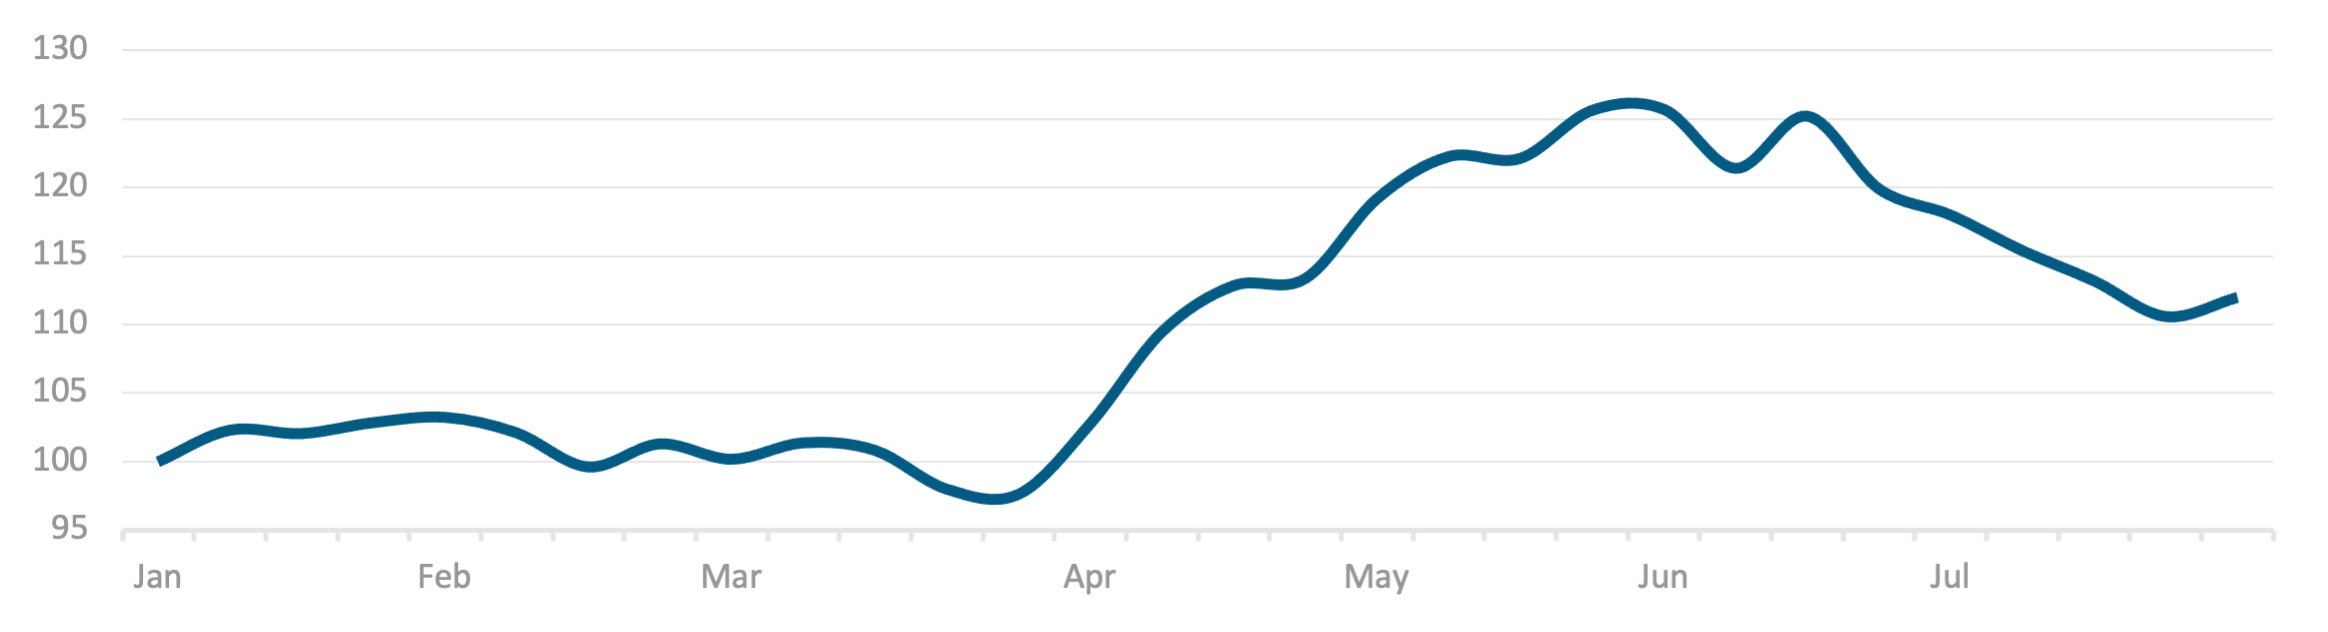
Concentration remains the principal equity risk. A market dependent on a small number of long-duration technology names is vulnerable to any further rise in real yields, however sound the underlying earnings.
03 REGIONAL DISPERSION
One year, four very different equity markets
Developed markets 2026 YTD
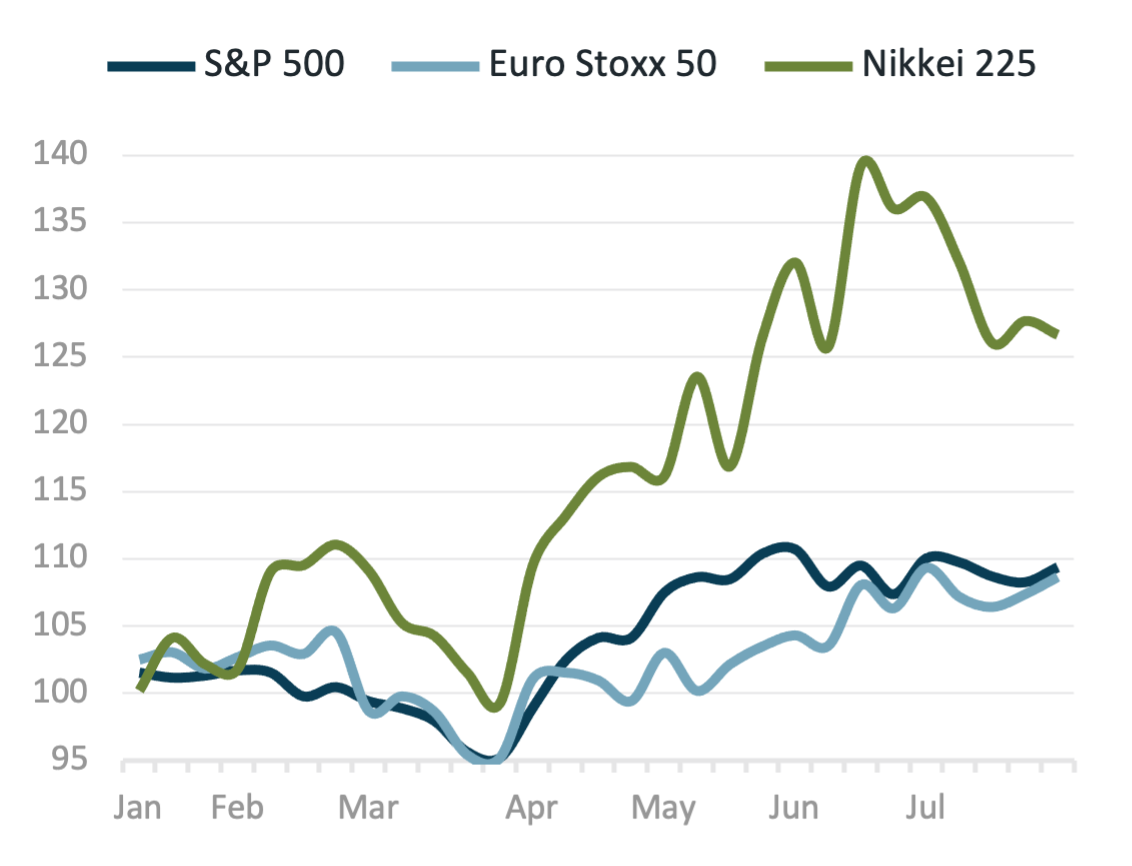
Source: Douglas Investments analysis; LSEG. Weekly closes rebased to 100 at 2 January 2026, in local currency
Emerging markets 2026 YTD
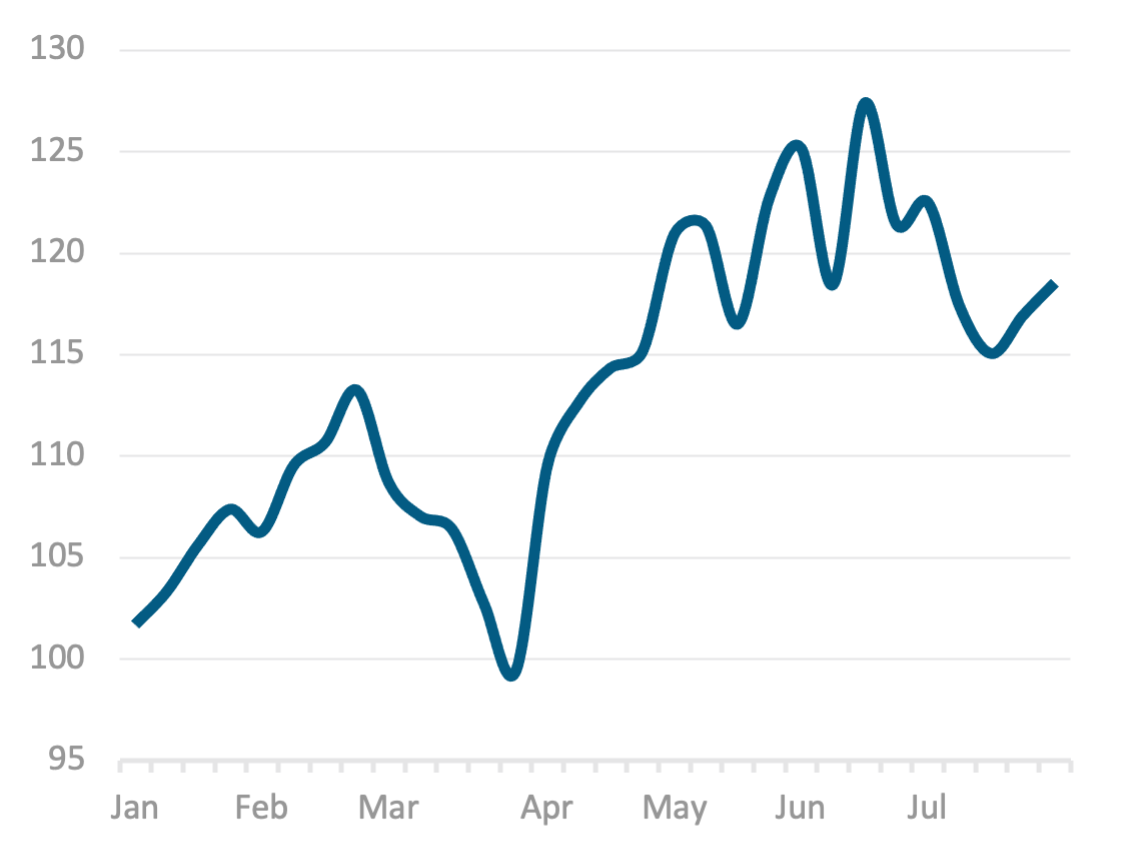
Source: Douglas Investments analysis; LSEG. Weekly closes rebased to 100 at 2 January 2026, in local currency

2026 has not been a single global equity market with significant divergence across major equity markets both in terms of performance and volatility. Japan has run well ahead of the United States for most of the year, driven by domestic reflation and corporate reform rather than the artificial-intelligence theme underpinning American returns. Europe has delivered a steadier but lower path, up 8.68% in 2026 and 0.47% in July.
July compressed that dispersion albeit negatively. The Nikkei's 8.14% fall came almost entirely from the yen's appreciation after coordinated intervention by the Japanese, Korean and US authorities — an exchange-rate event rather than an earnings event. Emerging markets tell a similar story from a different angle: up 18.54% for the year, yet down 3.31% in July as a higher expected path for US policy rates raised dollar funding costs and a 23.6% rise in crude delivered a direct terms-of-trade shock to importers. China split along the same line, with Shanghai down 6.8% while Hong Kong rose 12.3%. For a rand-based investor, currency has contributed as much to the 2026 outcome as equity selection has.
Dispersion of this magnitude is an argument for geographic breadth. Concentrating in the year's leader has repeatedly proved the least reliable way to capture it.
04 GEOPOLITICS & ENERGY
Crude reprices as Hormuz risk returns
Brent crude oil price USD per barrel, 2026 year to date
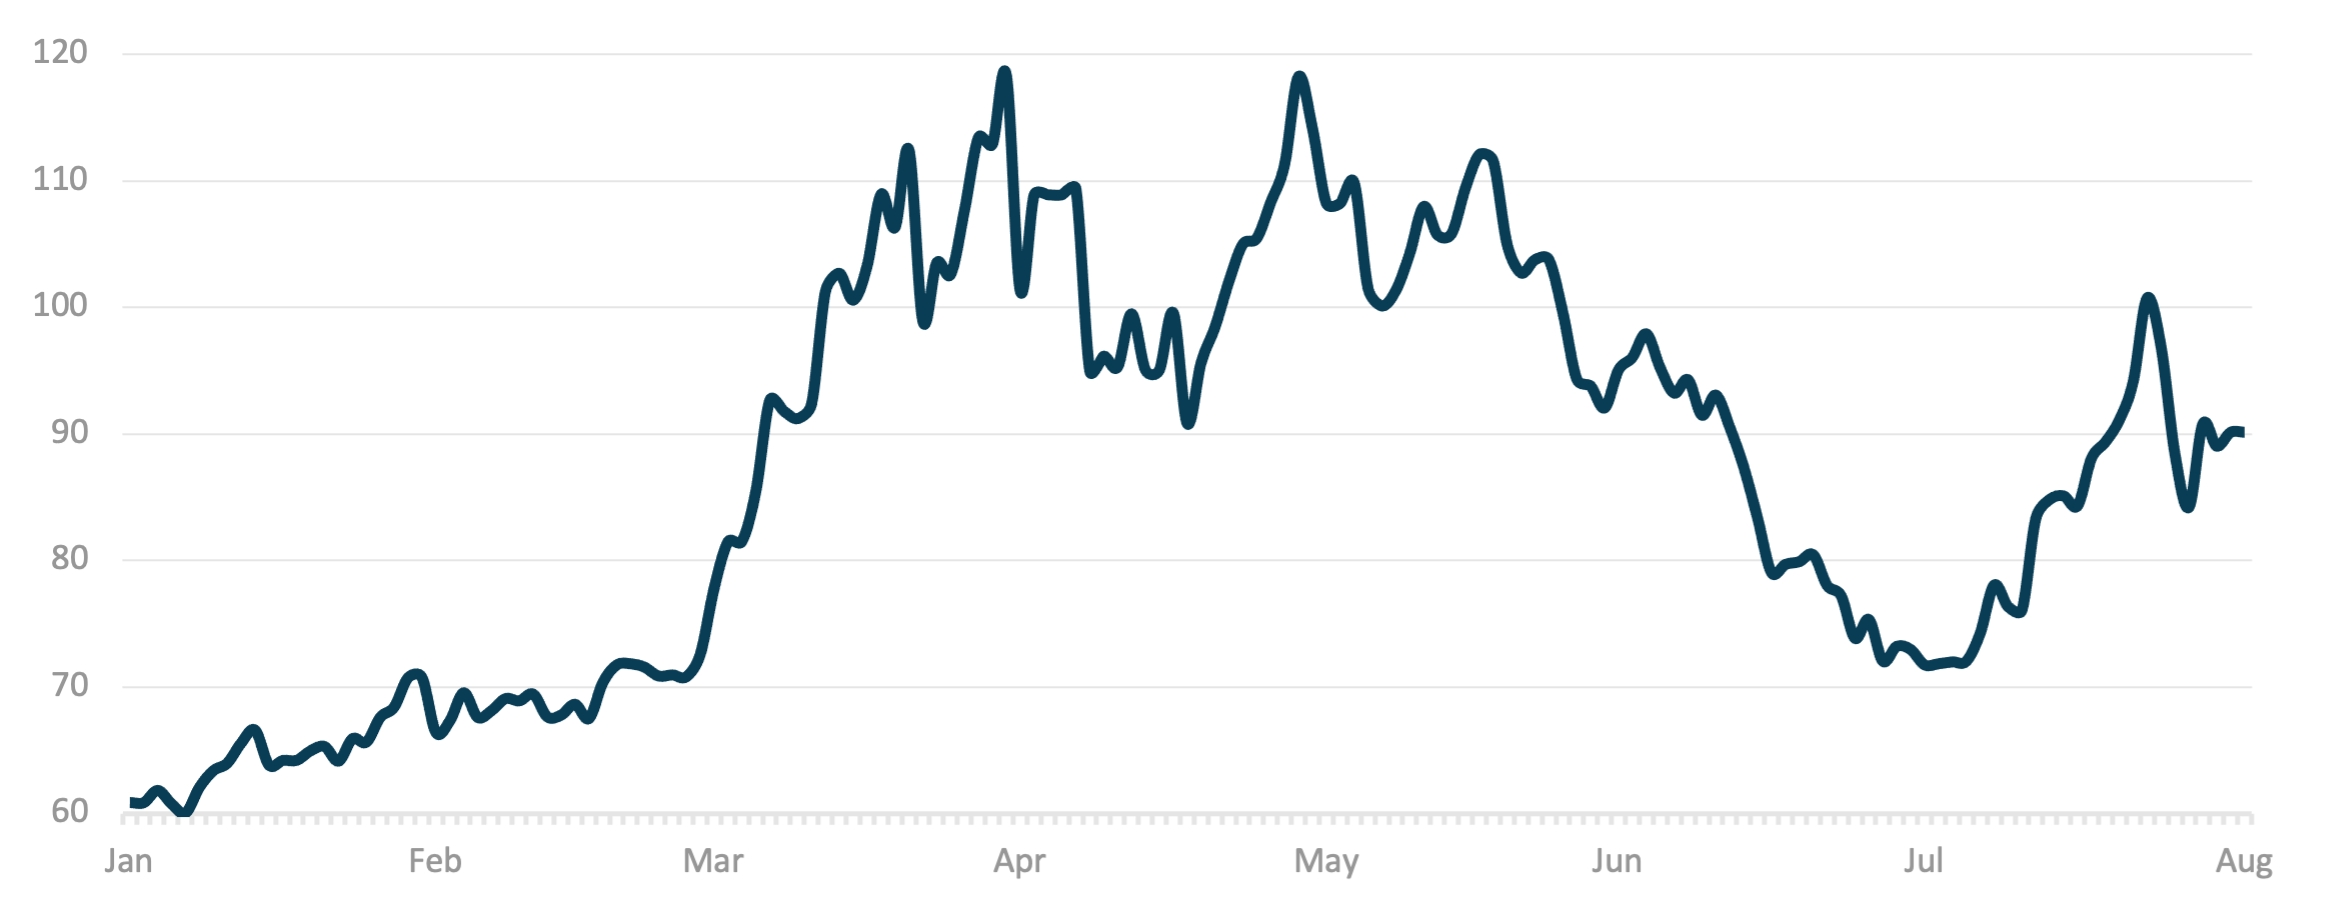
Source: Douglas Investments analysis; ICE Brent front-month, US dollars per barrel.
Conflict involving Iran and the threat of interference with shipping through the Strait of Hormuz — the route for roughly a fifth of seaborne crude — took Brent from $71.57 to $90.12 over July. Refined products moved further with European diesel cracks reaching a record $74.66 a barrel, signaling that the market was pricing disruption to refining as well as to supply.
OPEC+ has indicated additional output of roughly 188,000 barrels per day, which caps but does not remove the risk.
The investment consequence runs through inflation and ultimately central banks’ monetary policy rather than through energy equities alone. Diesel and jet fuel feed into freight, food and manufacturing costs with a lag of one to two quarters, which makes July's move a fourth-quarter inflation question as much as a July one. That is precisely why the Federal Reserve's tone hardened within days of the price rise. For portfolios, this argues for careful positioning and risk management while recognising that the move already discounts a meaningful probability of disruption. Should tensions ease, the round trip in crude could be as rapid as the ascent — as the second quarter of this year demonstrated, when Brent fell from $118 to $72 in under three months. Prudent management and strategic allocation to take advantage of opportunities in either direction is pivotal.
Crude has repriced on a risk premium rather than a supply loss, which is precisely why the move is reversible. Portfolios are best served by owning the inflation hedge and the earnings, not by trading the headline.
05 ENERGY SUPPLY
Why the supply response will be slow
Brent and WTI crude USD per barrel, 2026 year to date
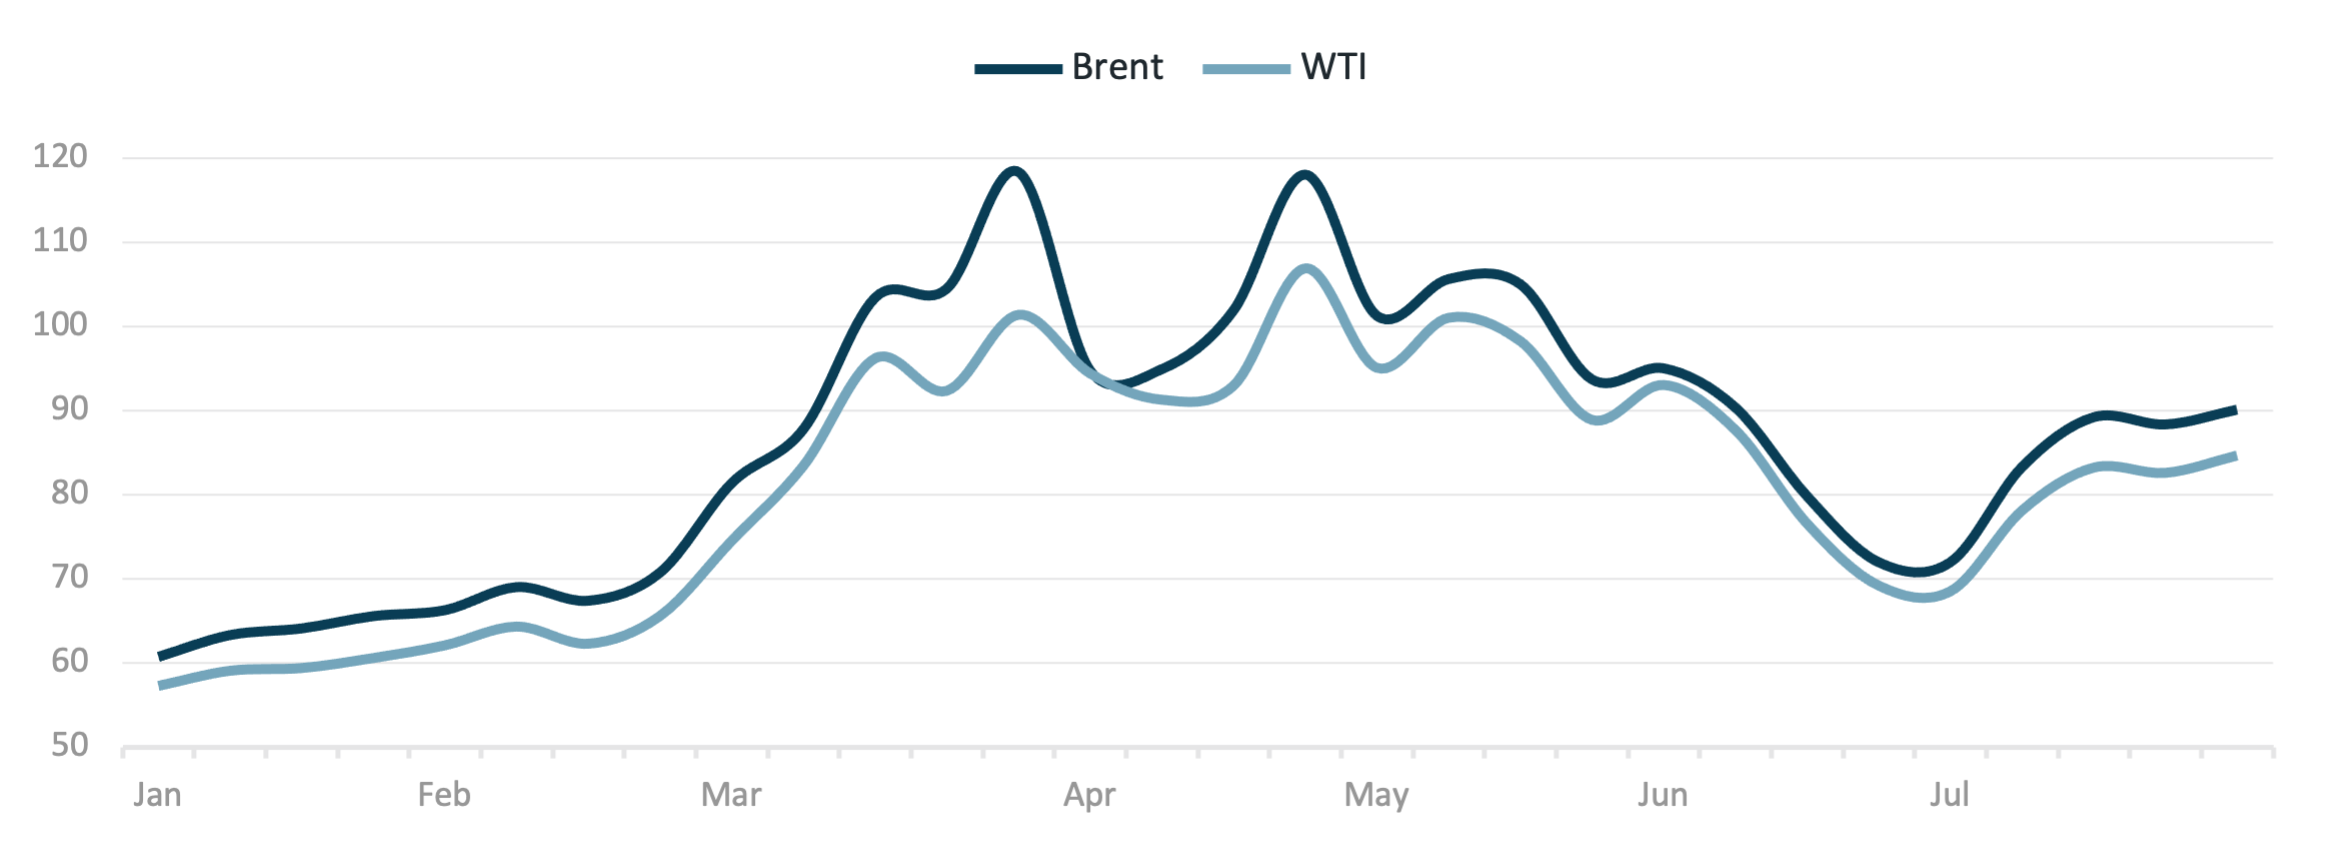
Source: Douglas Investments analysis; LSEG. Weekly closes, US dollars per barrel.
Brent and WTI have moved together all year, with the spread holding near six dollars. Analytically, this matters as the market is pricing a genuine global supply risk, not a North American bottleneck. Both benchmarks are now up more than 45% in 2026, and both made the bulk of that gain in two discrete episodes tied to conflict rather than to demand.
The International Energy Agency calls the current disruption the largest to oil supply in decades. However, prices sit well below the levels historically associated with a prolonged Hormuz closure. Ultimately, this distinction is a market judgement with investors retaining optimism of swift de-escalation driving prices accordingly. It is a reasonable base case, but one with limited margin for error, and it leaves the curve unusually sensitive to any single shipping incident.
US oil rig count number of rotary rigs drilling for oil
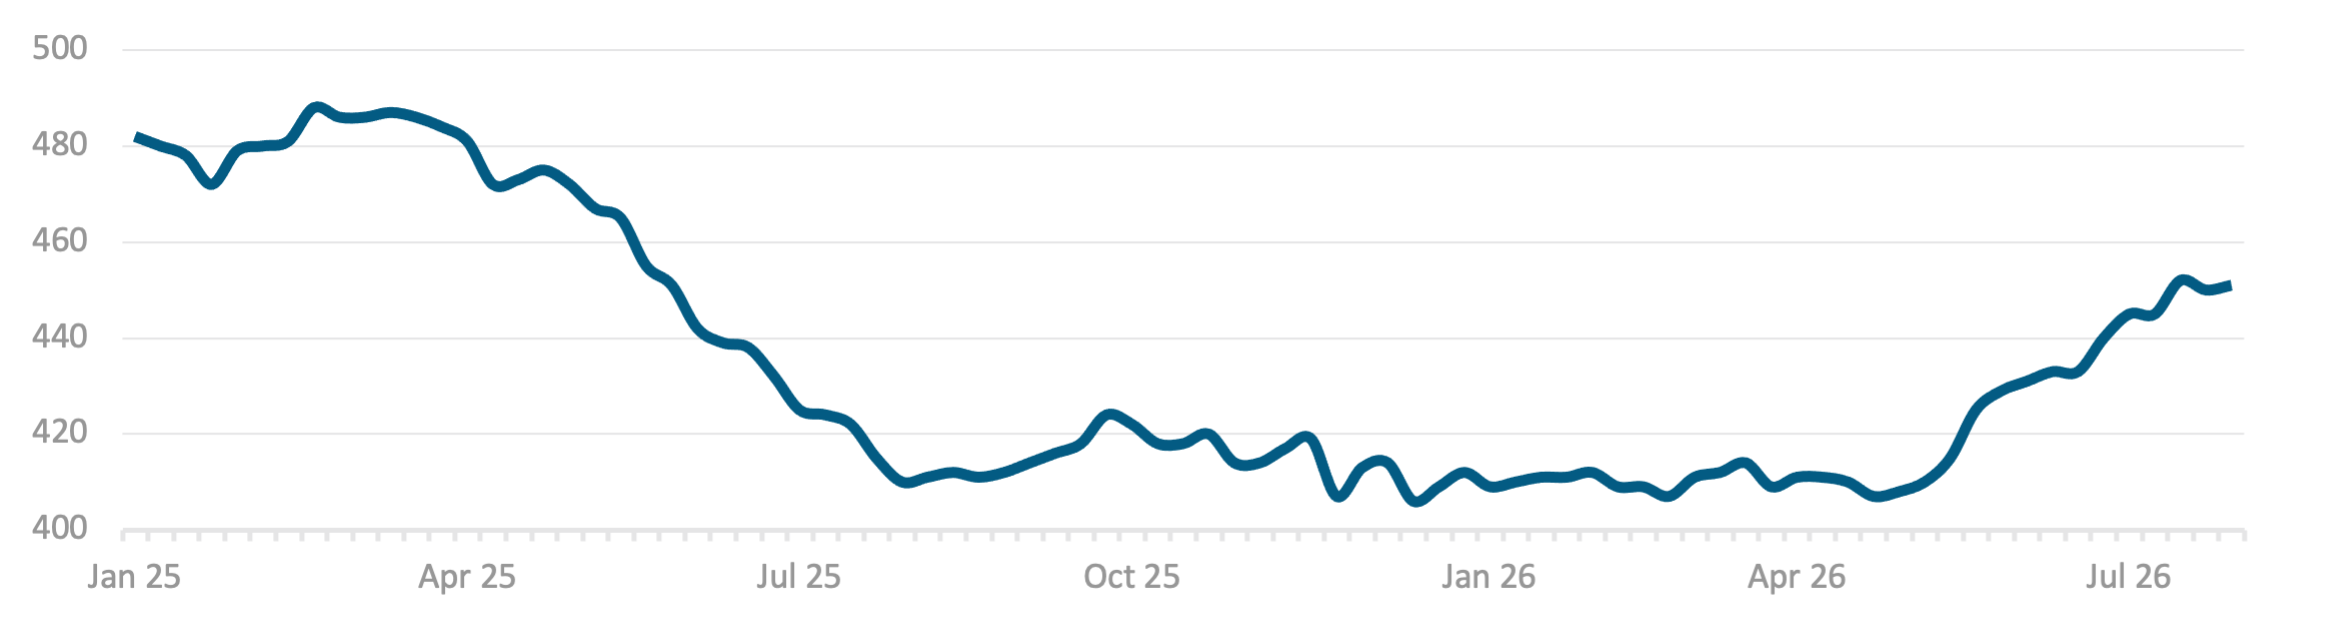
Drilling leads production by six to nine months, so rigs added this summer cannot lift barrels before 2027. A shock that cannot be met with supply must be met with price — the strongest argument for retaining inflation protection.
06 MACRO & RATES
A hawkish hold and a steeper curve

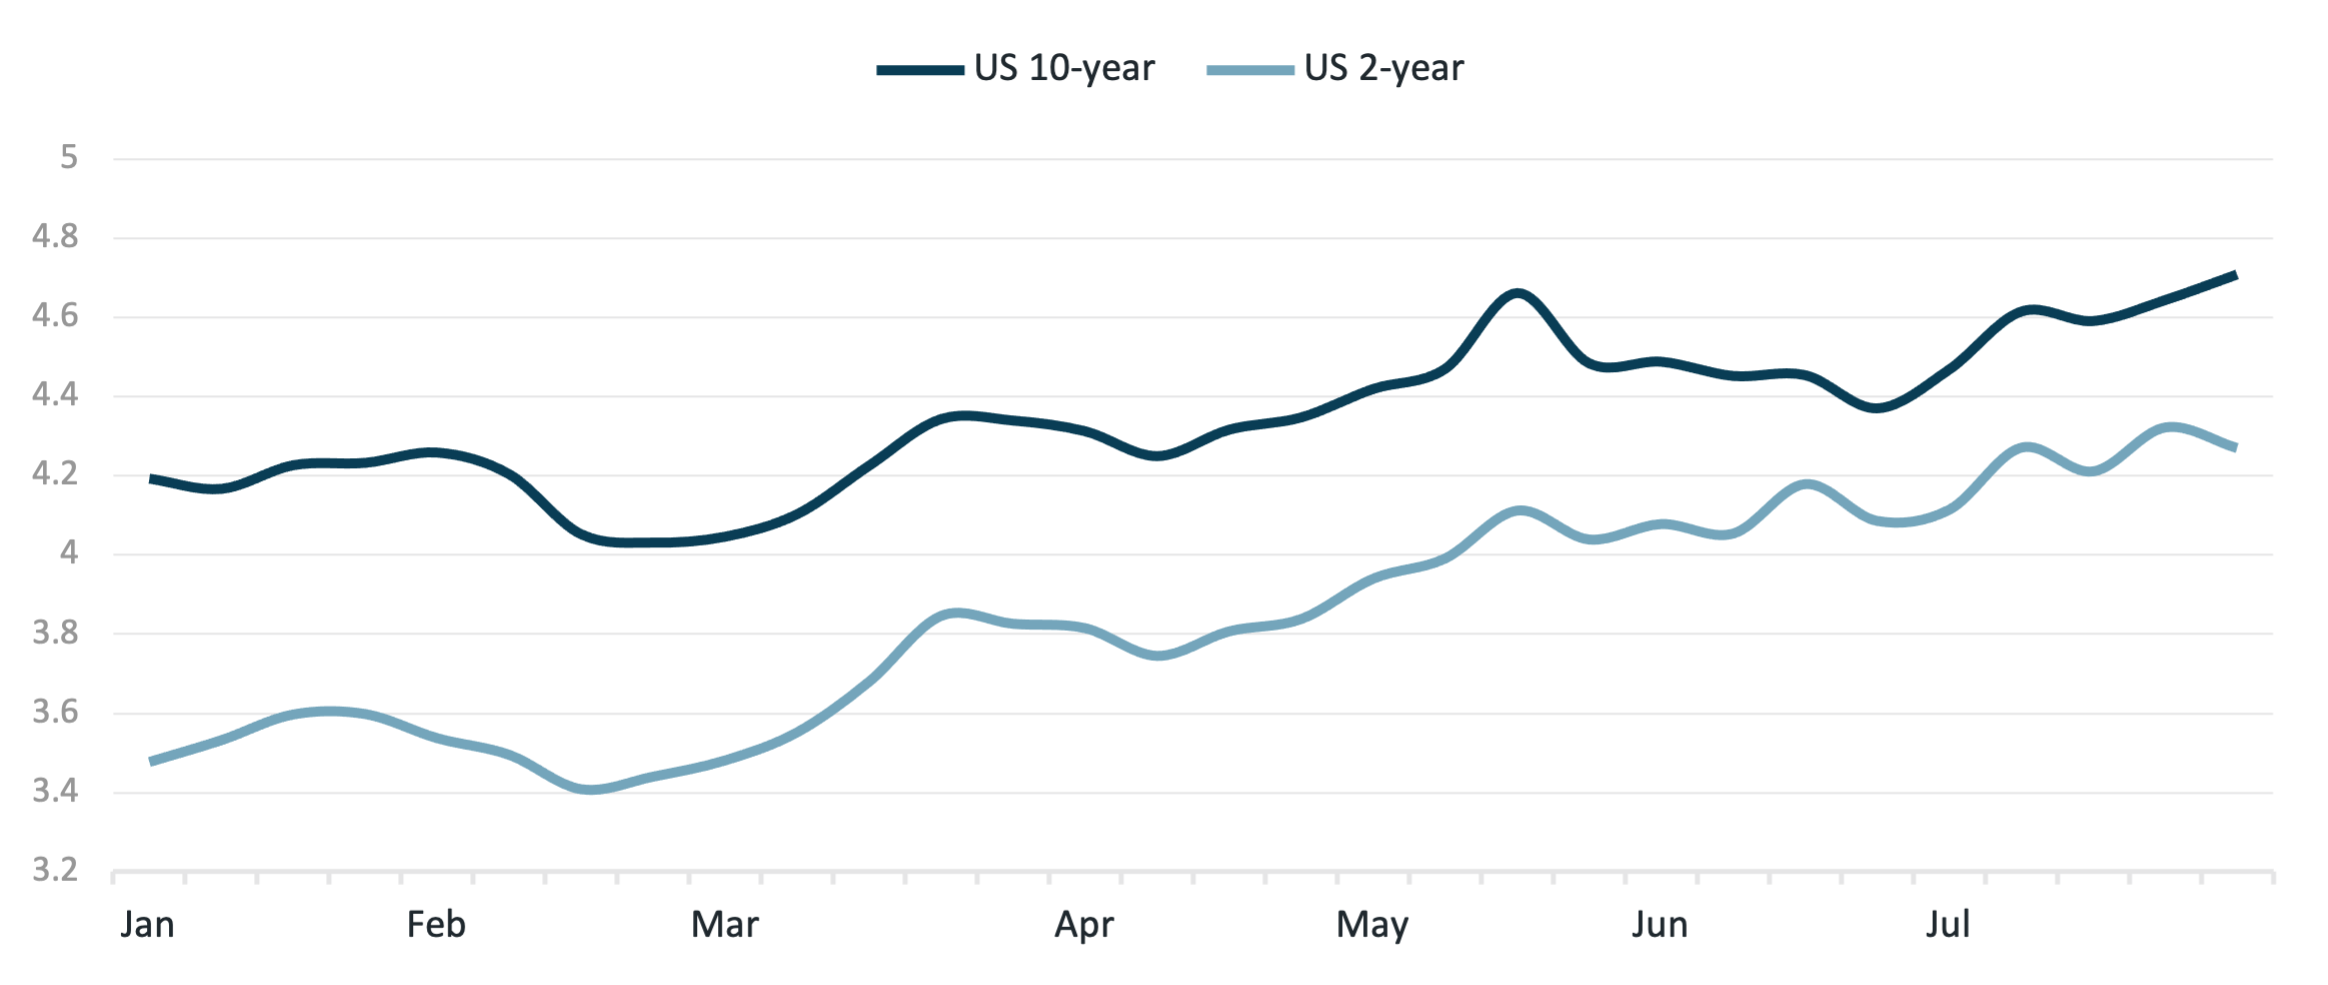
US Treasury yields 2Y and 10Y, %, 2026 year to date
Source: Douglas Investments analysis; LSEG. Weekly closing yields, per cent.
The Federal Reserve held at 3.50-3.75% on 29 July by a 9-3 vote, with Presidents Kashkari, Logan and Hammack dissenting in favour of a hike. Ten-year yields rose 27 basis points to 4.71% while two-year yields rose only 12 basis points, steepening the 2s10s curve by 15 basis points — a classic bear steepening driven by inflation risk, not growth optimism.
Monetary policy
Dispersion between central banks widened. The European Central Bank held its deposit rate at 2.25% on 23 July with euro-area flash inflation at 2.9%, while the Bank of England held at 3.75% for a fifth consecutive meeting on a 6-3 vote, with UK inflation projected to reach 3.2% by the fourth quarter. The Bank of Japan held at 1.0% by 8-1, with Mr Takata dissenting for 1.25%. Only the Federal Reserve faces an energy shock alongside inflation already close to 4%, which is why its tone hardened while others could afford to wait.
Fixed income
The long end bore the strain. The 30-year Treasury yield exceeded 5.20%, its highest since 2007, as investors demanded more compensation for holding duration through an uncertain inflation path. UK 10-year gilts reached 4.99%, the Bund traded at 3.17% and the BTP at 3.98%. For the first time in this cycle, nominal yields across the developed curve sit comfortably above expected inflation, restoring genuine income to fixed income for savers prepared to accept modest duration.
A curve steepening from the long end prices inflation risk, not recovery. The reward now sits in the short and intermediate maturities, where income is genuine and duration risk is modest.
07 RETURN DRIVERS
Resilient earnings, restless sentiment
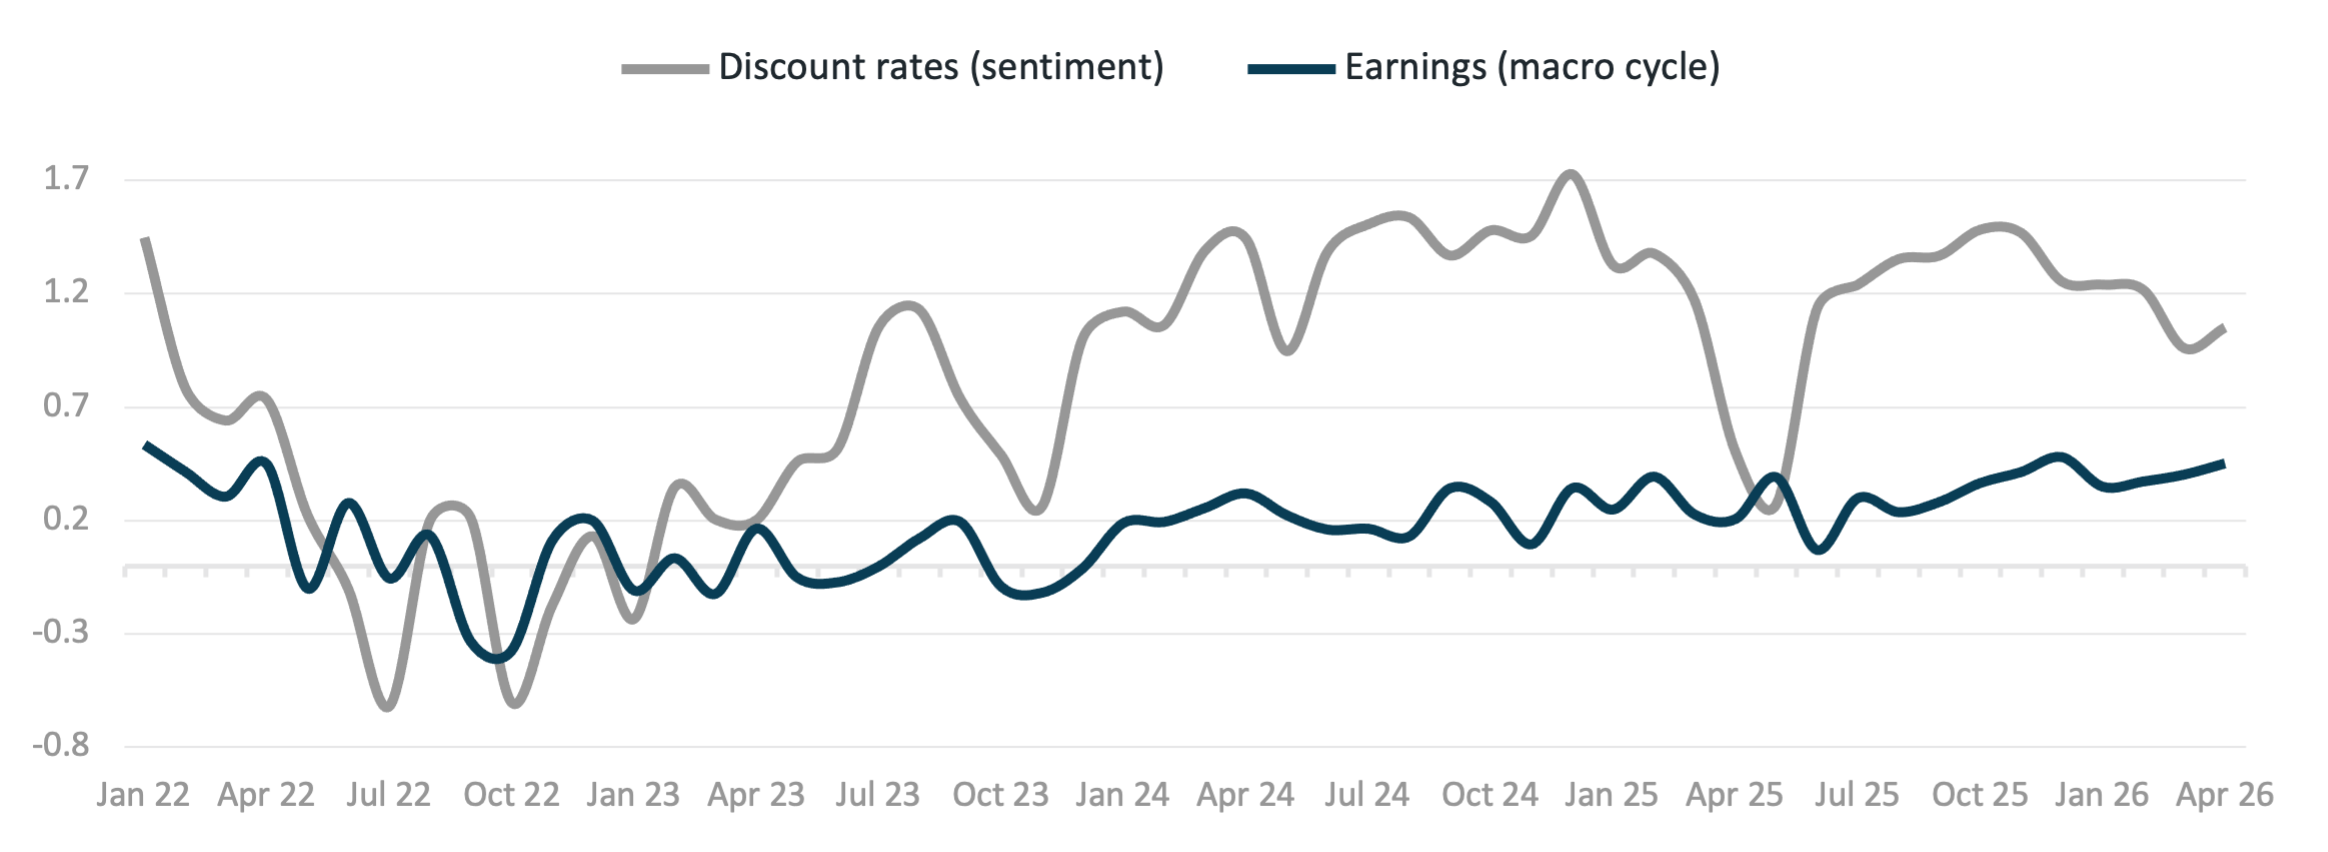
What is driving US equity returns discount rates versus earnings, monthly
Source: Douglas Investments analysis; LSEG. Monthly decomposition of US equity returns into the contribution from discount rates (sentiment) and from earnings (the macro cycle).
The chart above depicts the driving forces behind US equity returns. Every month's equity return can be split into two key elements. The navy line is the earnings contribution — i.e. what companies are actually expected to generate, and therefore how the real economy is doing. The grey line is the discount-rate contribution — i.e. the price investors are willing to pay for those earnings, which moves with confidence, geopolitics and interest-rate expectations.
The pattern is clear. The navy earnings line has stayed positive and comparatively steady, which translates to profit expectations withstanding pressure, and the macro backdrop has not deteriorated. Almost all of the recent swing sits in the grey discount-rate line, which has been volatile but is now improving. In plain terms, US equities have been resilient through the conflict because the underlying business picture is sound. Market movements on a month-to-month basis have been driven by how investors feel about geopolitical risk, not evidence that the economy is turning
Global liquidity conditions factor-mimicking portfolio, scaled
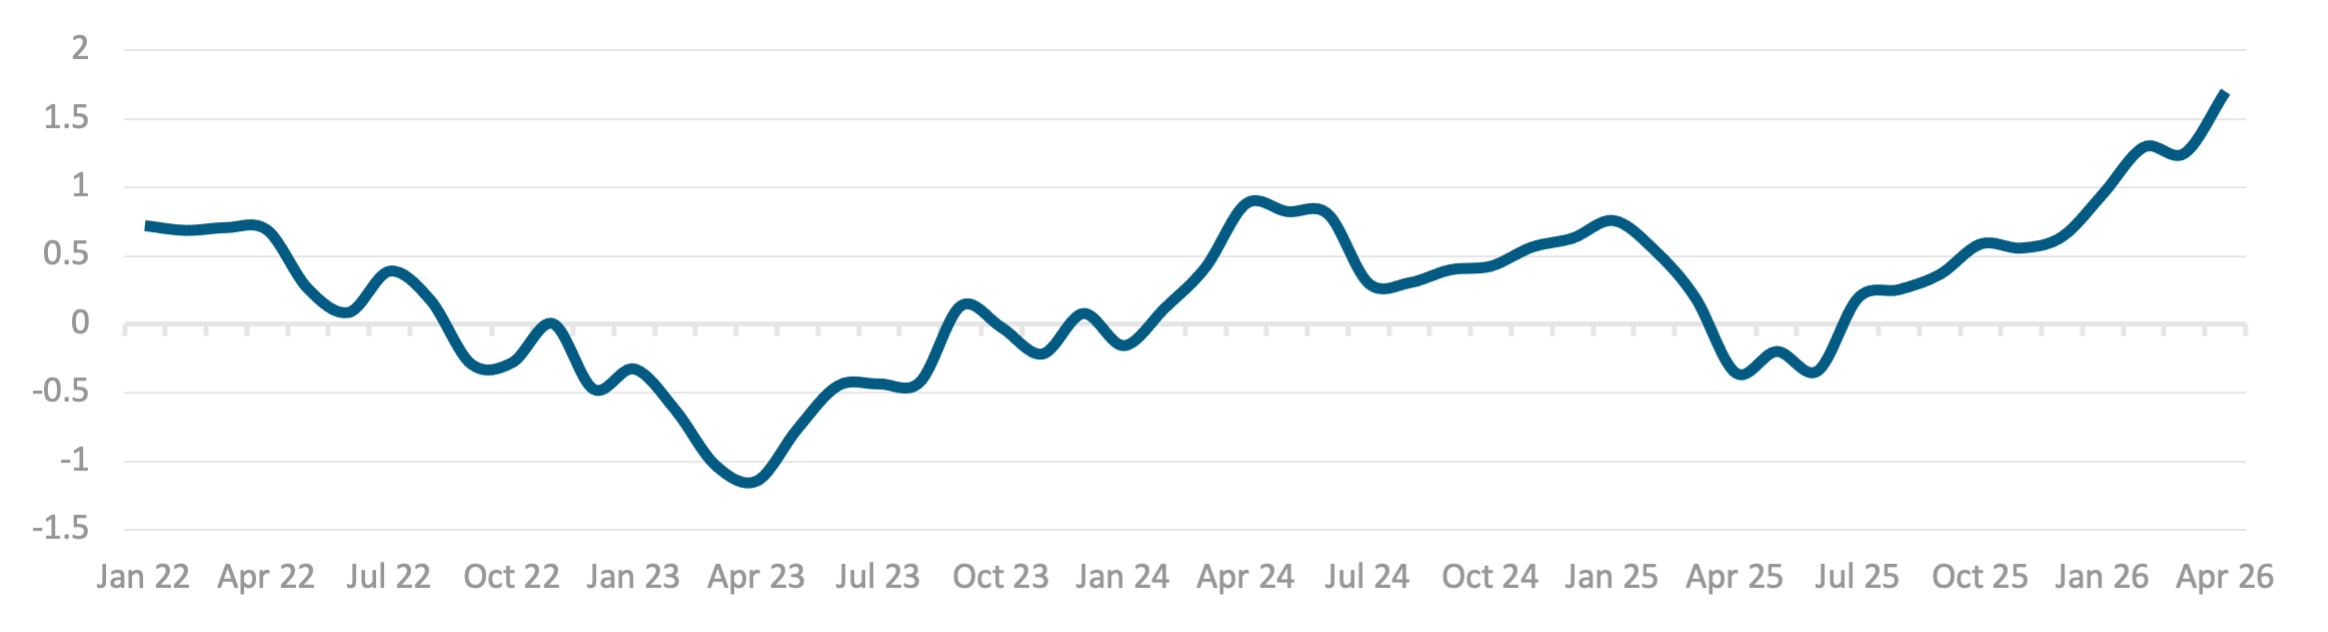
Volatility driven by sentiment rather than by earnings tends to reverse when the news improves. That is a reason to hold equity exposure through episodes like July rather than to reduce it.
08 US EARNINGS
Who pays for AI, and who profits from it
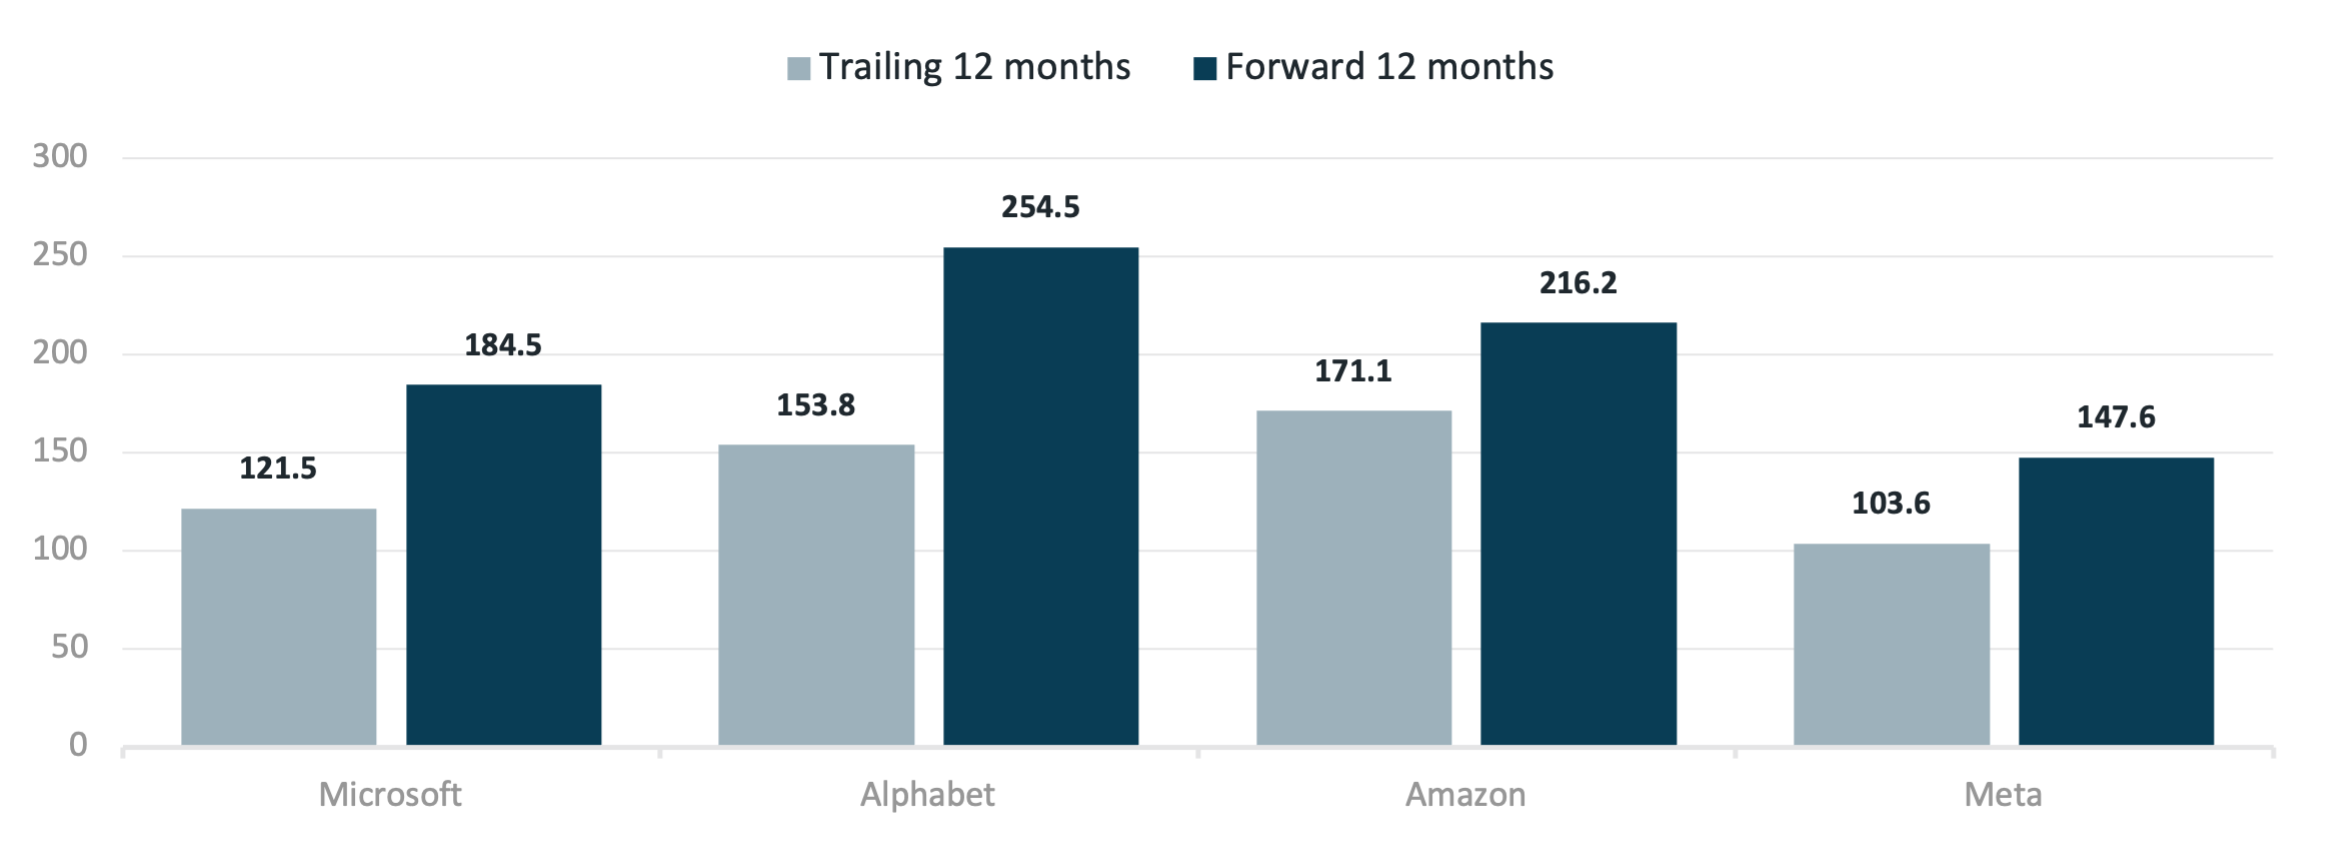
Hyperscaler AI capital expenditure trailing versus forward twelve months, US$bn
Source: Douglas Investments analysis; company reports and analyst aggregates, calendar Q2-2026 reporting season. Forward twelve-month figures are analyst-aggregated estimates and are subject to revision.
The late-July season confirmed that the US mega-caps are still growing, but the story has moved from growth itself to the cost of pursuing it. The four hyperscalers guided to roughly $802.8bn of capital expenditure over the coming twelve months against $550bn trailing, a rise of 45.9%. Alphabet leads the step-up, lifting guided spend by 65.5% to $254.5bn, ahead of Microsoft at 51.9%, Meta at 42.5% and Amazon at 26.4%.
This mattered because beats were the norm; however, the market only rewarded spending that visibly converts into revenue. Microsoft and Amazon, where cloud monetisation is measurable, gained 15.5% and 15.3% on the day, whereas Alphabet, Apple and Meta each fell 7-8%. Meta missed consensus by 14.4% despite revenue growth near 28%, representing an early sign of depreciation and running costs outpacing monetisation.
Latest reporting season headline results and one-day share price reaction
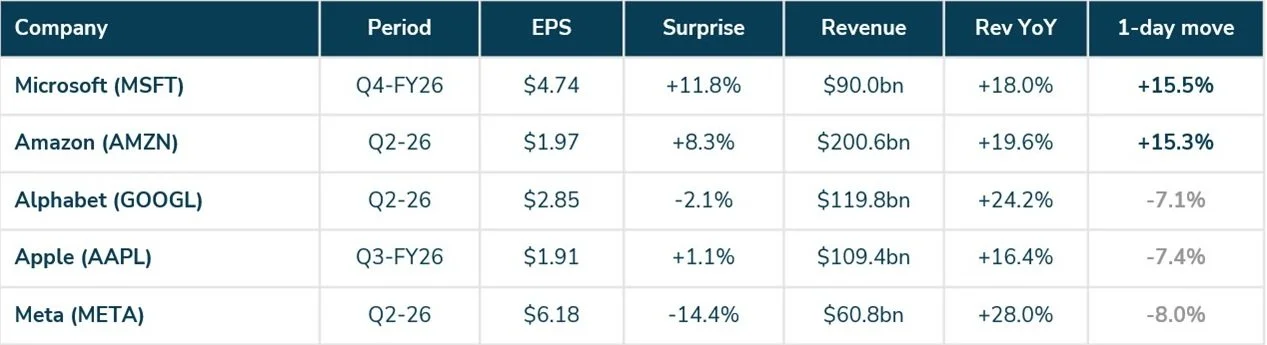
The question is no longer whether AI spending is large, but how long investors will fund it ahead of the cash flows. Dispersion within the mega-caps is now far wider than the index move suggests, which argues for judging each company on its own monetisation evidence.
09 SOUTH AFRICA
The Reserve Bank holds, and the rand steadies


The South African Reserve Bank surprised the market on 23 July by holding the repo rate at 7.00%, having been widely expected to hike with a 25bps hike widely priced in. The vote was 4-2 with two Monetary Policy Committee (MPC) members preferring a 25bp hike. With headline inflation at 5.0% and the Bank now anchoring policy on a 3% objective, the MPC decision combined with the dovish tone was a genuine policy surprise, at odds with market pricing. Inflation is not expected to return below 4% until early 2027.
The rand weakened to R16.82 and briefly R16.98 immediately after the decision before recovering to close July at R16.54, a modest 0.9% depreciation — a smaller move than the surprise alone would suggest, and evidence that the market read the hold as credibility-enhancing. The JSE All Share gained 1.07% in July and the Top 40 1.30%, supported by resources as commodity prices firmed, though both remain negative for 2026 at -3.75% and -4.60%. Money supply growth of 9.31% and private credit extension of 7.80% point to domestic demand holding up better than the equity market implies.


10 POSITIONING
Participating in opportunity without compromising on risk
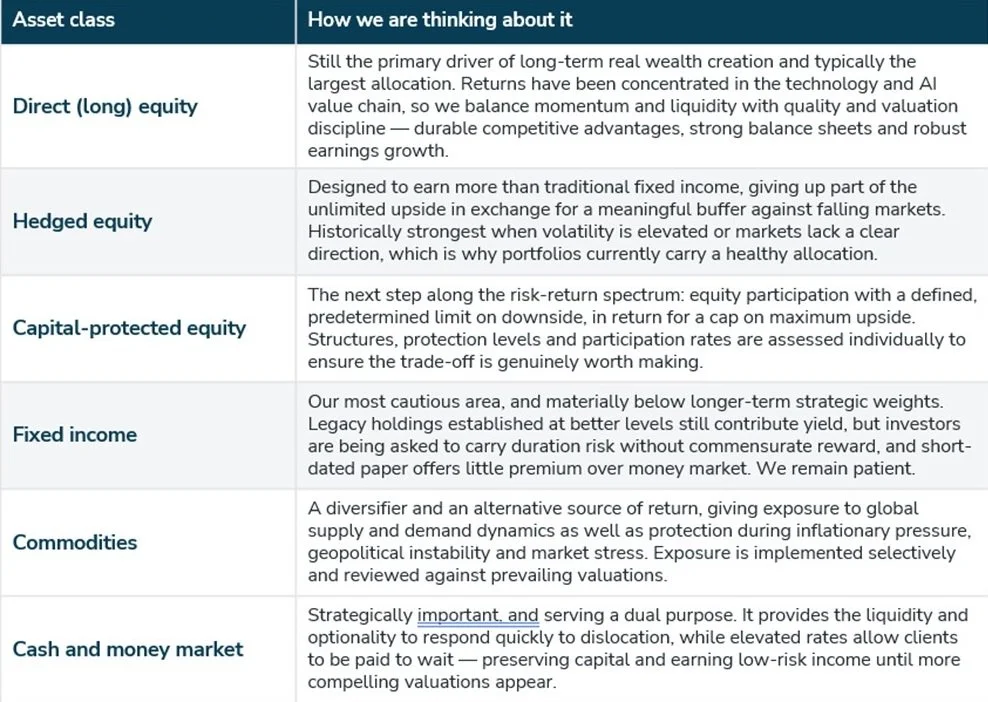
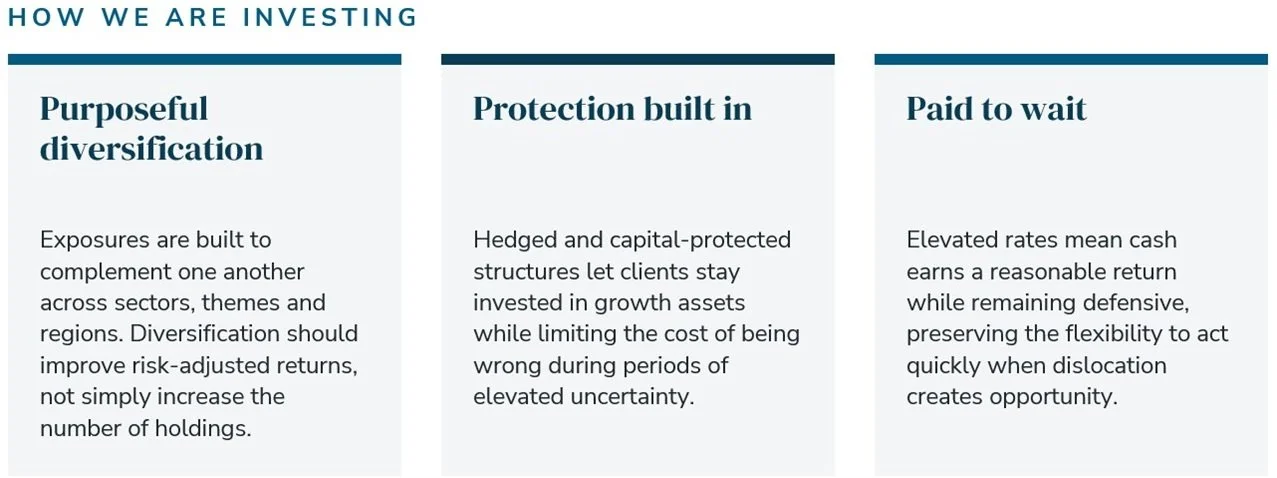
Our house view remains positive but measured towards growth assets. Heightened macroeconomic uncertainty, shifting monetary policy expectations, geopolitical tension and evolving market leadership all argue for portfolios that are resilient yet flexible enough to act as opportunities emerge. The framework below sets out how we are currently thinking about each of the six asset classes we use, with weightings always tailored to a client's objectives, risk tolerance, liquidity needs and time horizon.
11 OUTLOOK
Patience, priced properly
July turned the market's central question from the pace of easing to whether easing arrives at all in 2026. The answer depends less on growth — which remains adequate, with US real final sales to private domestic purchasers up 3.9% — than on whether the energy shock passes through into core inflation. Supportive global liquidity and resilient earnings argue against a disorderly outcome; a hawkish Federal Reserve and an oil supply that cannot respond quickly argue against a swift return to lower yields. We therefore expect higher yields, wider dispersion and periodic rotation rather than a single directional trend.